

Unexpected mobility variation among individual secretory vesicles produces an apparent refractory neuropeptide pool
- PMID: 12770915
- PMCID: PMC1302991
- DOI: 10.1016/S0006-3495(03)75137-6
Unexpected mobility variation among individual secretory vesicles produces an apparent refractory neuropeptide pool
Abstract
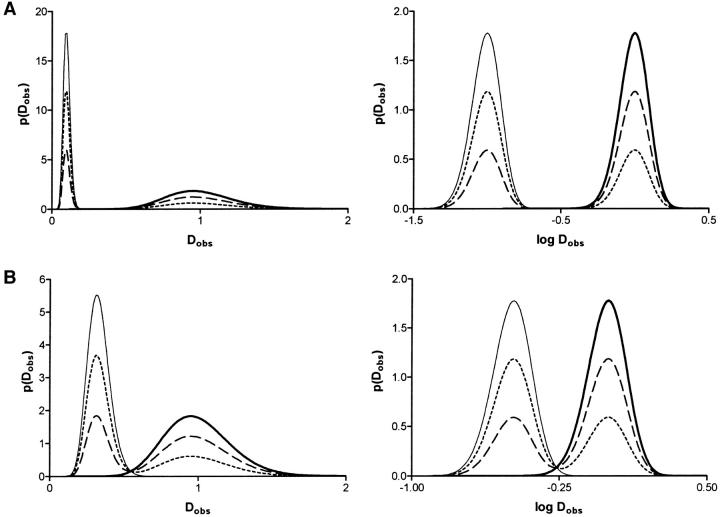
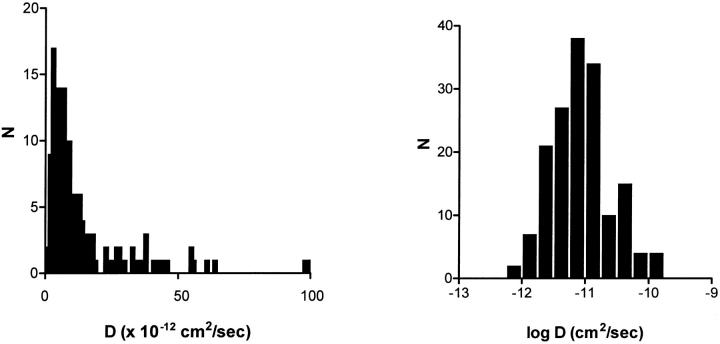
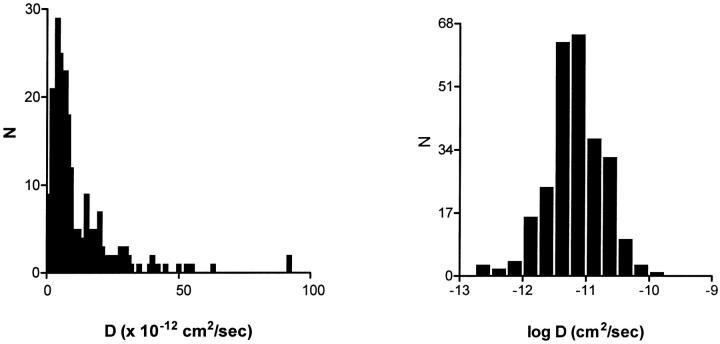
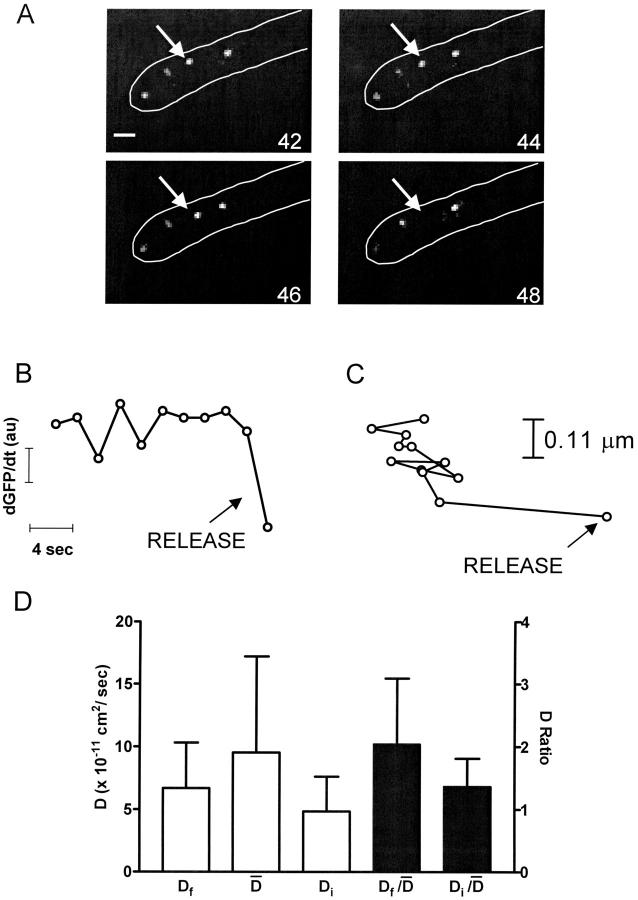
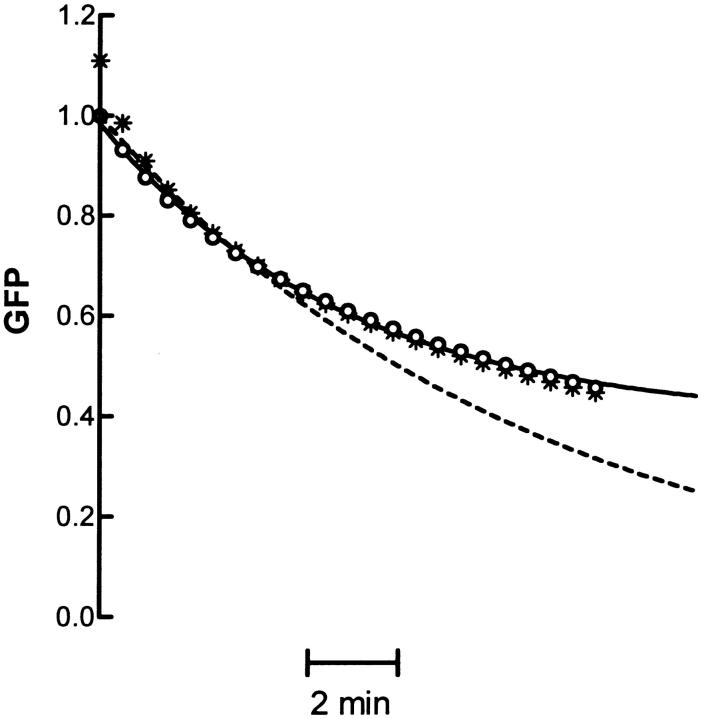
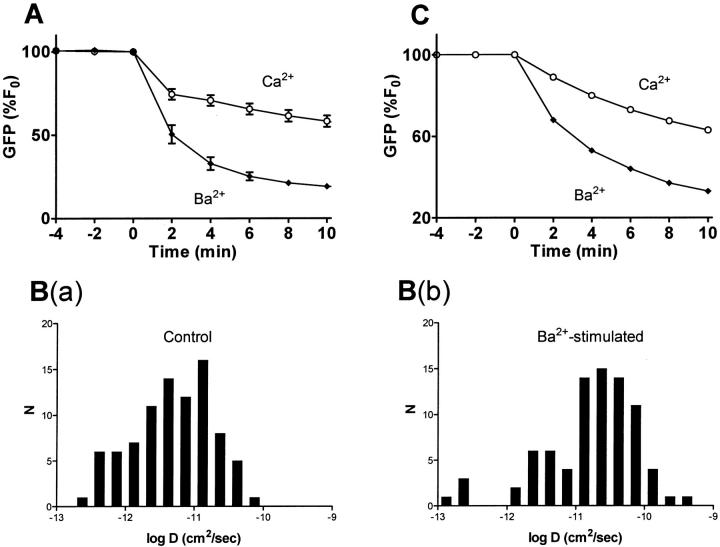
Most stored neuropeptide cannot be released from nerve terminals suggesting the existence of a refractory pool of dense core vesicles (DCVs). Past fluorescence photobleaching recovery, single particle tracking and release experiments suggested that the refractory neuropeptide pool corresponds to a distinct immobile fraction of cytoplasmic DCVs. However, tracking of hundreds of individual green fluorescent protein-labeled neuropeptidergic vesicles by wide-field or evanescent-wave microscopy shows that a separate immobile fraction is not evident. Instead, the DCV diffusion coefficient (D) distribution is unusually broad and asymmetric. Furthermore, the distribution shifts with a release facilitator. This unexpected variation, which could reflect heterogeneity among vesicles or in their medium, is shown to generate the appearance of a regulated refractory neuropeptide pool.
Figures
Similar articles
-
Physical mobilization of secretory vesicles facilitates neuropeptide release by nerve growth factor-differentiated PC12 cells.J Physiol. 2002 Jul 15;542(Pt 2):395-402. doi: 10.1113/jphysiol.2002.021733. J Physiol. 2002. PMID: 12122140 Free PMC article.
-
Activity Induces Fmr1-Sensitive Synaptic Capture of Anterograde Circulating Neuropeptide Vesicles.J Neurosci. 2016 Nov 16;36(46):11781-11787. doi: 10.1523/JNEUROSCI.2212-16.2016. J Neurosci. 2016. PMID: 27852784 Free PMC article.
-
Neuropeptide release by efficient recruitment of diffusing cytoplasmic secretory vesicles.Proc Natl Acad Sci U S A. 1999 Dec 7;96(25):14577-82. doi: 10.1073/pnas.96.25.14577. Proc Natl Acad Sci U S A. 1999. PMID: 10588747 Free PMC article.
-
Sorting of neuropeptides and neuropeptide receptors into secretory pathways.Prog Neurobiol. 2010 Feb 9;90(2):276-83. doi: 10.1016/j.pneurobio.2009.10.011. Epub 2009 Oct 22. Prog Neurobiol. 2010. PMID: 19853638 Review.
-
How neurosecretory vesicles release their cargo.Neuroscientist. 2006 Apr;12(2):164-76. doi: 10.1177/1073858405284258. Neuroscientist. 2006. PMID: 16514013 Review.
Cited by
-
Segmentation of 3D Trajectories Acquired by TSUNAMI Microscope: An Application to EGFR Trafficking.Biophys J. 2016 Nov 15;111(10):2214-2227. doi: 10.1016/j.bpj.2016.09.041. Biophys J. 2016. PMID: 27851944 Free PMC article.
-
Synaptic neuropeptide release by dynamin-dependent partial release from circulating vesicles.Mol Biol Cell. 2015 Jul 1;26(13):2466-74. doi: 10.1091/mbc.E15-01-0002. Epub 2015 Apr 22. Mol Biol Cell. 2015. PMID: 25904335 Free PMC article.
-
Analysis of transient behavior in complex trajectories: application to secretory vesicle dynamics.Biophys J. 2006 Nov 1;91(9):3542-59. doi: 10.1529/biophysj.105.080622. Epub 2006 Aug 4. Biophys J. 2006. PMID: 16891360 Free PMC article.
-
Mechanisms of transport and exocytosis of dense-core granules containing tissue plasminogen activator in developing hippocampal neurons.J Neurosci. 2005 Mar 23;25(12):3095-106. doi: 10.1523/JNEUROSCI.4694-04.2005. J Neurosci. 2005. PMID: 15788766 Free PMC article.
-
Three-dimensional tracking of single secretory granules in live PC12 cells.Biophys J. 2004 Sep;87(3):1991-2001. doi: 10.1529/biophysj.104.043281. Biophys J. 2004. PMID: 15345575 Free PMC article.
References
-
- Berg, H. C. 1993. Random Walks in Biology, revised edition. Princeton University Press, Princeton, N.J.
-
- Burke, N., W. Han, D. Li, K. Takimoto, S. C. Watkins, and E. S. Levitan. 1997. Neuronal peptide release is limited by secretory granule mobility. Neuron. 19:1095–1102. - PubMed
-
- Crank, J. 1975. The Mathematics of Diffusion. p. 18. Oxford University Press, New York.
Publication types
MeSH terms
Substances
Grants and funding
LinkOut - more resources
Full Text Sources
Miscellaneous
