

Activation of phospholipase C increases intramembrane electric fields in N1E-115 neuroblastoma cells
- PMID: 12770917
- PMCID: PMC1302993
- DOI: 10.1016/S0006-3495(03)75139-X
Activation of phospholipase C increases intramembrane electric fields in N1E-115 neuroblastoma cells
Abstract
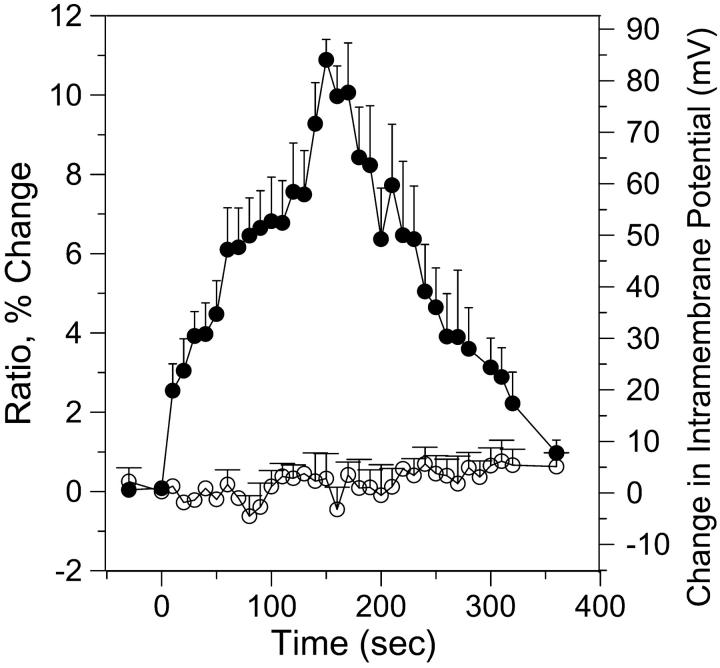
We imaged the intramembrane potential (a combination of transmembrane, surface, and dipole potential) on N1E-115 neuroblastoma cells with a voltage-sensitive dye. After activation of the B(2) bradykinin receptor, the electric field sensed by the dye increased by an amount equivalent to a depolarization of 83 mV. The increase in intramembrane potential was blocked by the phospholipase C (PLC) inhibitors U-73122 and neomycin, and was invariably accompanied by a transient rise of [Ca(2+)](i). A depolarized inner surface potential, as the membrane loses negative charges via phosphatidylinositol 4,5-bisphosphate (PIP(2)) hydrolysis, and an increase in the dipole potential, as PIP(2) is hydrolyzed to 1,2-diacylglycerol (DAG), can each account for a small portion of the change in intramembrane potential. The primary contribution to the measured change in intramembrane potential may arise from an increased dipole potential, as DAG molecules are generated from hydrolysis of other phospholipids. We found bradykinin produced an inhibition of a M-type voltage-dependent K(+) current (I(K(M))). This inhibition was also blocked by the PLC inhibitors and had similar kinetics as the bradykinin-induced modulation of intramembrane potential. Our results suggest that the change in the local intramembrane potential induced by bradykinin may play a role in mediating the I(K(M)) inhibition.
Figures


Similar articles
-
The effects of bradykinin on K+ currents in NG108-15 cells treated with U73122, a phospholipase C inhibitor, or neomycin.Br J Pharmacol. 1997 Mar;120(5):841-50. doi: 10.1038/sj.bjp.0700991. Br J Pharmacol. 1997. PMID: 9138690 Free PMC article.
-
Binding of PLCdelta1PH-GFP to PtdIns(4,5)P2 prevents inhibition of phospholipase C-mediated hydrolysis of PtdIns(4,5)P2 by neomycin.Acta Pharmacol Sin. 2005 Dec;26(12):1485-91. doi: 10.1111/j.1745-7254.2005.00223.x. Acta Pharmacol Sin. 2005. PMID: 16297348
-
Bradykinin- and thrombin-induced increases in endothelial permeability occur independently of phospholipase C but require protein kinase C activation.J Cell Physiol. 1997 Dec;173(3):387-96. doi: 10.1002/(SICI)1097-4652(199712)173:3<387::AID-JCP11>3.0.CO;2-9. J Cell Physiol. 1997. PMID: 9369952
-
Bradykinin acutely inhibits activity of the epithelial Na+ channel in mammalian aldosterone-sensitive distal nephron.Am J Physiol Renal Physiol. 2011 May;300(5):F1105-15. doi: 10.1152/ajprenal.00606.2010. Epub 2011 Feb 16. Am J Physiol Renal Physiol. 2011. PMID: 21325499 Free PMC article.
-
The effect of asymmetric surface potentials on the intramembrane electric field measured with voltage-sensitive dyes.Biophys J. 2003 Apr;84(4):2768-80. doi: 10.1016/S0006-3495(03)75081-4. Biophys J. 2003. PMID: 12668484 Free PMC article.
Cited by
-
Sensitivity of second harmonic generation from styryl dyes to transmembrane potential.Biophys J. 2004 Feb;86(2):1169-76. doi: 10.1016/S0006-3495(04)74191-0. Biophys J. 2004. PMID: 14747351 Free PMC article.
-
SLIT3-mediated intratumoral crosstalk induces neuroblastoma differentiation via a spontaneous regression-like program.J Transl Med. 2025 May 30;23(1):598. doi: 10.1186/s12967-025-06621-0. J Transl Med. 2025. PMID: 40448172 Free PMC article.
-
Hippocampal neurons maintain a large PtdIns(4)P pool that results in faster PtdIns(4,5)P2 synthesis.J Gen Physiol. 2022 Mar 7;154(3):e202113001. doi: 10.1085/jgp.202113001. Epub 2022 Feb 18. J Gen Physiol. 2022. PMID: 35179558 Free PMC article.
-
Wavelength- and time-dependence of potentiometric non-linear optical signals from styryl dyes.J Membr Biol. 2005 Nov;208(2):103-11. doi: 10.1007/s00232-005-0823-y. J Membr Biol. 2005. PMID: 16645740
-
Membrane dipole potential as measured by ratiometric 3-hydroxyflavone fluorescence probes: accounting for hydration effects.J Fluoresc. 2006 Jan;16(1):35-42. doi: 10.1007/s10895-005-0022-3. Epub 2006 Jan 7. J Fluoresc. 2006. PMID: 16400505
References
-
- Agranoff, B. W., P. Murthy, and E. B. Seguin. 1983. Thrombin-induced phosphodiesteratic cleavage of phosphatidylinositol bisphosphate in human platelets. J. Biol. Chem. 258:2076–2078. - PubMed
-
- Bai, J., and R. E. Pagano. 1997. Measurement of spontaneous transfer and transbilayer movement of BODIPY-labeled lipids in lipid vesicles. Biochemistry. 36:8840–8848. - PubMed
-
- Bedlack, R. S., Jr., M.-d. Wei, S. H. Fox, E. Gross, and L. M. Loew. 1994. Distinct electric potentials in soma and neurite membranes. Neuron. 13:1187–1193. - PubMed
-
- Berridge, M. J. 1993. Inositol trisphosphate and calcium signaling. Nature. 361:315–325. - PubMed
-
- Bowlby, M. R., and I. B. Levitan. 1995. Block of cloned voltage-gated potassium channels by the second messenger diacylglycerol independent of protein kinase C. J. Neurophysiol. 73:2221–2229. - PubMed
Publication types
MeSH terms
Substances
Grants and funding
LinkOut - more resources
Full Text Sources
Medical
Miscellaneous
