. 2003 Jun 2;197(11):1489-500.
doi: 10.1084/jem.20021925. Epub 2003 May 27.

Identification of a polymorphic gene, BCL2A1, encoding two novel hematopoietic lineage-specific minor histocompatibility antigens

Affiliations

Identification of a polymorphic gene, BCL2A1, encoding two novel hematopoietic lineage-specific minor histocompatibility antigens

Yoshiki Akatsuka et al. J Exp Med. .

Abstract

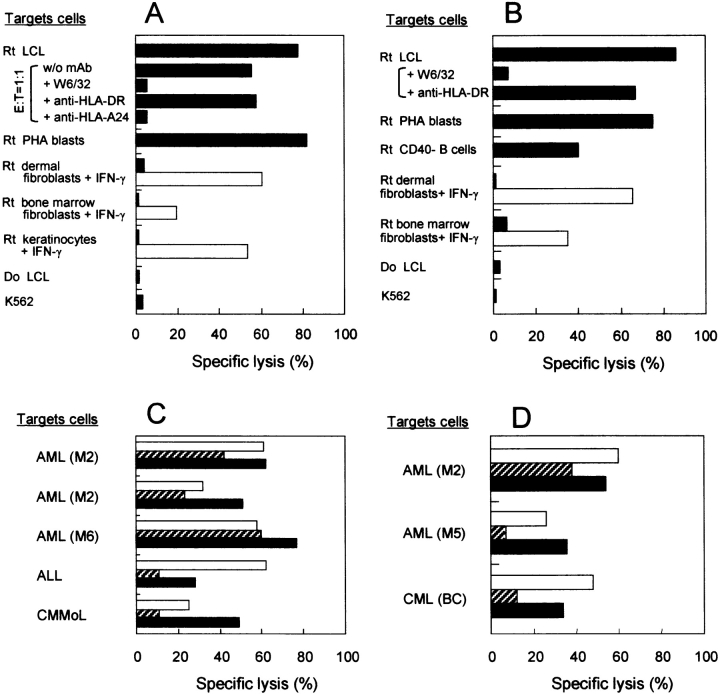
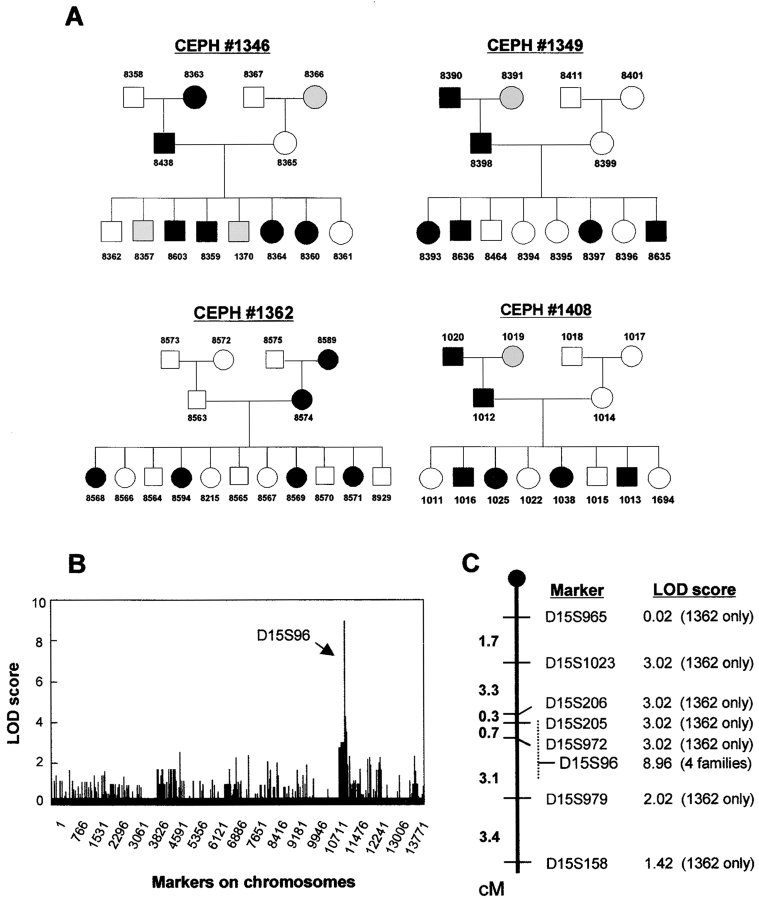
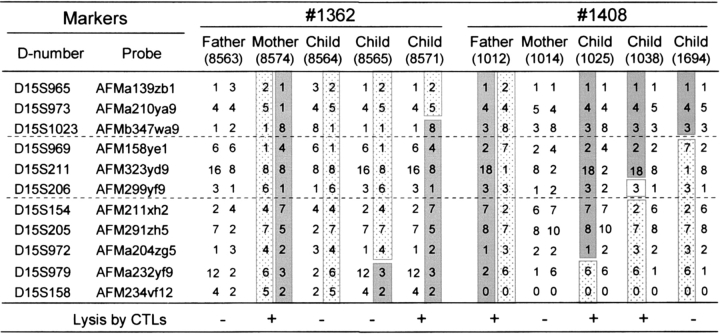
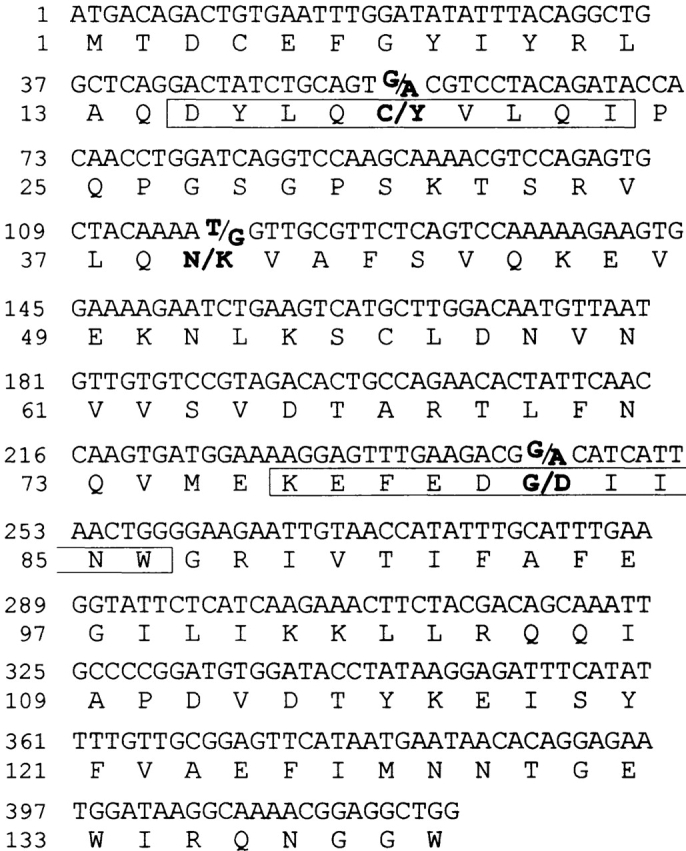
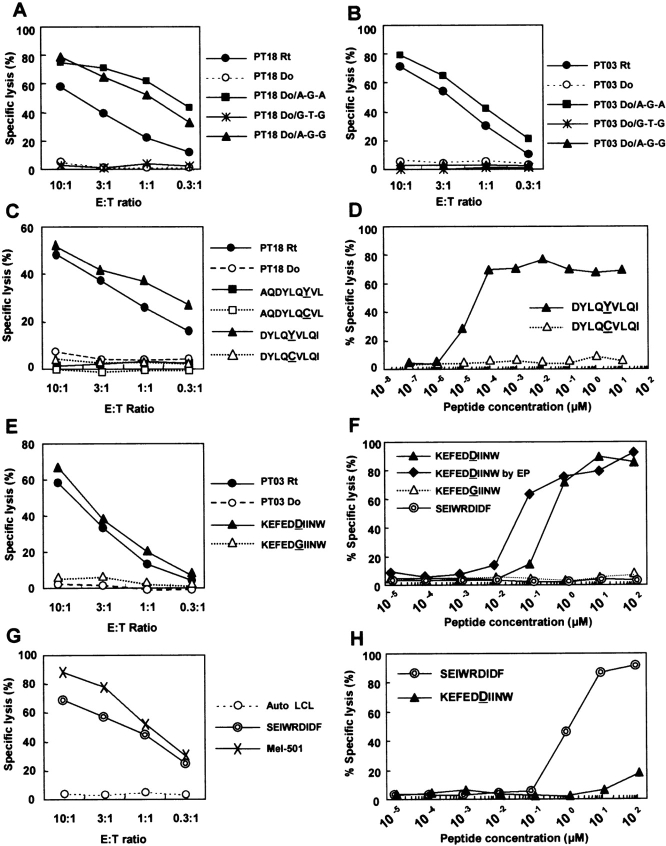
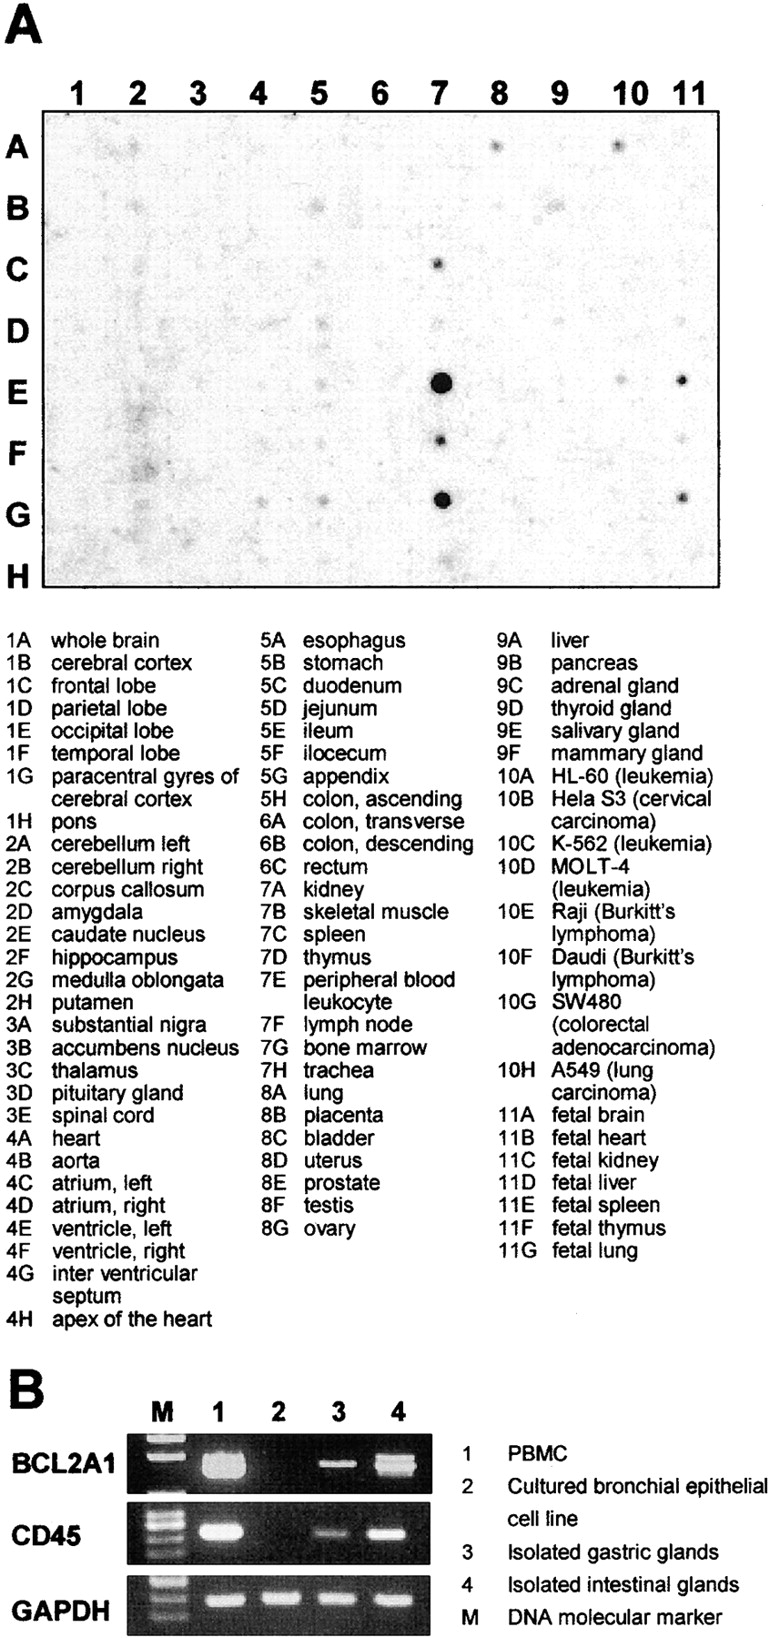
We report the identification of two novel minor histocompatibility antigens (mHAgs), encoded by two separate single nucleotide polymorphisms on a single gene, BCL2A1, and restricted by human histocompatibility leukocyte antigen (HLA)-A*2402 (the most common HLA-A allele in Japanese) and B*4403, respectively. Two cytotoxic T lymphocyte (CTL) clones specific for these mHAgs were first isolated from two distinct recipients after hematopoietic cell transplantation. Both clones lyse only normal and malignant cells within the hematopoietic lineage. To localize the gene encoding the mHAgs, two-point linkage analysis was performed on the CTL lytic patterns of restricting HLA-transfected B lymphoblastoid cell lines obtained from Centre d'Etude du Polymorphisme Humain. Both CTL clones showed a completely identical lytic pattern for 4 pedigrees and the gene was localized within a 3.6-cM interval of 15q24.3-25.1 region that encodes at least 46 genes. Of those, only BCL2A1 has been reported to be expressed in hematopoietic cells and possess three nonsynonymous nucleotide changes. Minigene transfection and epitope reconstitution assays with synthetic peptides identified both HLA-A*2402- and B*4403-restricted mHAg epitopes to be encoded by distinct polymorphisms within BCL2A1.


Figures

Figure 1.
Figure 1.
Specificity of CTL clones analyzed in standard 51Cr release assays. (A) HLA-A*2402–restricted CTL 18B3/A24 and (B) HLA-B*4403–restricted CTL 3B5/B44 were tested against target cells derived from recipient (Rt) or donor (Do) normal tissues at an E/T ratio of 10:1. Recipient (Rt) dermal fibroblasts, bone marrow fibroblasts, and/or keratinocytes were incubated with 100 U/ml IFN-γ for 48 h before chromium labeling. Lysis by (A) allo HLA-A24– and (B) allo HLA-B44–specific CTL against nonhematopoietic cells are shown as open bars. Antibody blocking of the cytolysis was conducted with anti-HLA mAbs (E/T ratios: 1:1 for CTL 18B3/A24 and 10:1 for CTL 3B5/B44). (C) CTL 18B3/A24 and (D) CTL 3B5/B44 were tested against restricting HLA-matched primary leukemic cells. Frozen cryopreserved leukemic cells incubated with (solid bar) or without (hatched bar) 10 ng/ml TNF-α for 48 h before assay. PHA-stimulated T cell blasts (open bars) were generated from T cells contaminating in the corresponding leukemic blast. AML, acute myelocytic leukemia identified according to the French-American-British classification; ALL, acute lymphocytic leukemia; CMMoL, chronic myelomonocytic leukemia; CML (BC), chronic myelocytic leukemia in blast crisis.
Figure 2.
Figure 2.
Linkage analysis. (A) The results of phenotyping for the pedigrees of CEPH families. Filled symbols (▪, males; •, females) represent individuals scored as positive in the 18B3/A24 cytotoxic assay and open symbols (□, males; ○, females) represent individuals scored as negative. Shaded symbols represent individuals from whom no LCL was available. Numbers above or below the symbols were assigned to each family member by the University of Utah (reference 34). The identical lysis pattern was also observed with CTL 3B5/B44. (B) Distribution of the LOD scores for each genetic marker on whole chromosomes are shown serially starting from the proximal end of chromosome 1. (C) Genetic map of distal chromosome 15q showing relative positions of marker loci, oriented with the 15q telomere at the bottom of the figure. LOD scores for each marker are indicated to the right of each marker. Because families other than 1362 have not been mapped extensively, families used to calculate the LOD scores are indicated in the parentheses. The location of the marker D15S96 that gave the highest LOD score has not been well defined, therefore its potential region on the map is indicated as a dashed line.
Figure 3.
Figure 3.
The gene(s) encoding the mHAgs defined by CTLs 18B3/A24 and 3B5/B44 are mapped to a 3.6-cM interval spanned by the markers D15S1023/AFMb347wa9 and D15S154/AFM211xh2. The parental probands and their informative offspring who had inherited recombinant haplotypes between the markers D15S965/AFMa139zb1 and D15S158/AFM234vf12 correspond to the region shown in Fig. 2 C. Genotypes of the requisite markers for family 1408 that were not available at the CEPH database (references and 41) were examined in our laboratory. The genotypes are arranged by haplotype, with the paternally and maternally inherited haplotypes on the left and right, respectively. The appearance of a 0 in any haplotype indicates that no genotype was available and was not further examined. The susceptibility of individual LCL to the two CTL clones is indicated at the bottom of the figure. The parental haplotypes carrying gene(s) controlling mHAgs that were deduced by the segregation pattern (Fig. 2 A) in each family are shown in shaded blocks and their “antigen-negative” counterparts are shown in hatched blocks. Open blocks indicate regions that cannot be assigned to a parental haplotype. Thus, recombinant haplotypes are those composed of two blocks with different symbols, and the recombination event is thought to have occurred between the markers in different blocks.
Figure 4.
Figure 4.
Nucleotide and deduced amino acid sequences of the human BCL2A1 exon 1 cDNA. The deduced amino acid sequence is shown in one-letter designation below the nucleotide sequence. All three reported nonsynonymous SNPs (positions 56, 116, and 245) and the corresponding amino acid residues (positions 19, 39, and 82) are indicated in bold type. The sequence corresponding to the CTLs 18B3/A24- and 3B5/B44-defined peptides is boxed.
Figure 5.
Figure 5.
The two mHAg epitopes defined by CTLs 18B3/A24 and 3B5/B44 are encoded by a single gene BCL2A1. Mammalian expression plasmids encoding three allelic forms of the BCL2A1 exon 1 identified in the correlation study (refer to Table II) were transfected into (A) PT18 donor (Do) LCL and (B) PT03 donor LCL and their susceptibility to (A) CTL 18B3/A24 and (B) CTL 3B5/B44 was tested. Individual recipient (Rt) LCL was used as positive control. (C) Identification of CTL 18B3/A24-defined epitope. Susceptibility of PT18 donor LCL transduced with minigene constructs encoding BCL2A1 polymorphic peptides spanning amino acid 19 was assessed in a standard 51Cr release assay. Two pairs of nonamer peptides starting at amino acid positions 13 and 15 with binding score of 1.0 or higher were predicted by BIMAS software (reference 44). Polymorphic amino acids (Y or C) are underlined. CTL lysis of PT18 recipient (Rt) and donor (Do) is also shown. (D) mHAg epitope reconstitution with synthetic nonamer peptides with amino acid sequence starting at position 15. (E) Identification of CTL 3B5/B44-defined epitope. Susceptibility of PT03 donor LCL transduced with minigene constructs encoding two BCL2A1 polymorphic peptides (KEFEDDIINW and KEFEDGIINW, refer to Table III) was tested at various E/T ratio. Polymorphic amino acids (D or G) are underlined. CTL lysis of PT03 recipient (Rt) and donor (Do) is also shown. (F) mHAg epitope reconstitution with synthetic decamer peptides. Besides conventional peptide pulsing, direct delivery of synthetic peptides into the cytosol by electroporation was used (EP). As negative control, HLA-B*4403–restricted tyrosinase epitope (SEIWRDIDF; reference 31) was used. (G) An HLA-B*4403–restricted tyrosinase epitope (SEIWRDIDF)-specific CTL was generated from a normal donor and tested against autologous (Auto) LCL, autologous LCL transduced with minigene constructs encoding SEIWRDIDF, or HLA-B*4403–transduced Mel-501 melanoma cell line with intrinsic expression of tyrosinase. (H) Reconstitution assay for synthetic peptides using the tyrosinase-specific CTL.
Figure 6.
Figure 6.
(A) RNA dot blot analysis of BCL2A1 gene expression in 68 distinct human tissues and 8 tumor cell lines. Tissue sources for the RNA are indicated below the blot. (B) BCL2A1 and CD45 expression of PBMC, cultured bronchial epithelial cell line, and isolated glands from stomach and intestine. Gene-specific RT-PCR was performed with a predetermined amount of each cDNA based on the PCR results for GAPDH.

References

    1. Wallny, H.J., and H.G. Rammensee. 1990. Identification of classical minor histocompatibility antigen as cell-derived peptide. Nature. 343:275–278. - PubMed
    1. Simpson, E., and D. Roopenian. 1997. Minor histocompatibility antigens. Curr. Opin. Immunol. 9:655–661. - PubMed
    1. Goulmy, E. 1997. Human minor histocompatibility antigens: new concepts for marrow transplantation and adoptive immunotherapy. Immunol. Rev. 157:125–140. - PubMed
    1. Niederwieser, D., A. Grassegger, J. Aubock, M. Herold, D. Nachbaur, A. Rosenmayr, A. Gachter, W. Nussbaumer, S. Gaggl, M. Ritter, et al. 1993. Correlation of minor histocompatibility antigen-specific cytotoxic T lymphocytes with graft-versus-host disease status and analysis of tissue distribution of their target antigens. Blood. 81:2200–2208. - PubMed
    1. Faber, L.M., S.A.P. van Luxemburg-Heijs, R. Willemze, and J.H.F. Falkenburg. 1992. Generation of leukemia-reactive cytotoxic T lymphocyte clones from the HLA-identical bone marrow donor of a patient with leukemia. J. Exp. Med. 176:1283–1289. - PMC - PubMed

Publication types