. 2003 Jun;121(6):495-510.
doi: 10.1085/jgp.200208770.

Custom distinctions in the interaction of G-protein beta subunits with N-type (CaV2.2) versus P/Q-type (CaV2.1) calcium channels

Affiliations

Custom distinctions in the interaction of G-protein beta subunits with N-type (CaV2.2) versus P/Q-type (CaV2.1) calcium channels

Heather L Agler et al. J Gen Physiol. 2003 Jun.

Abstract

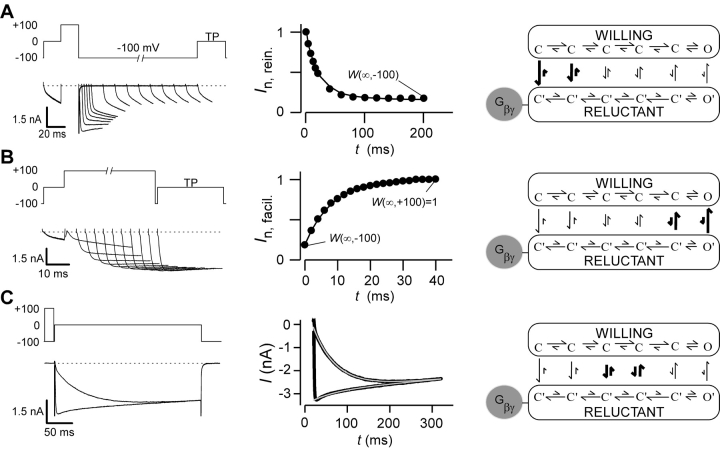
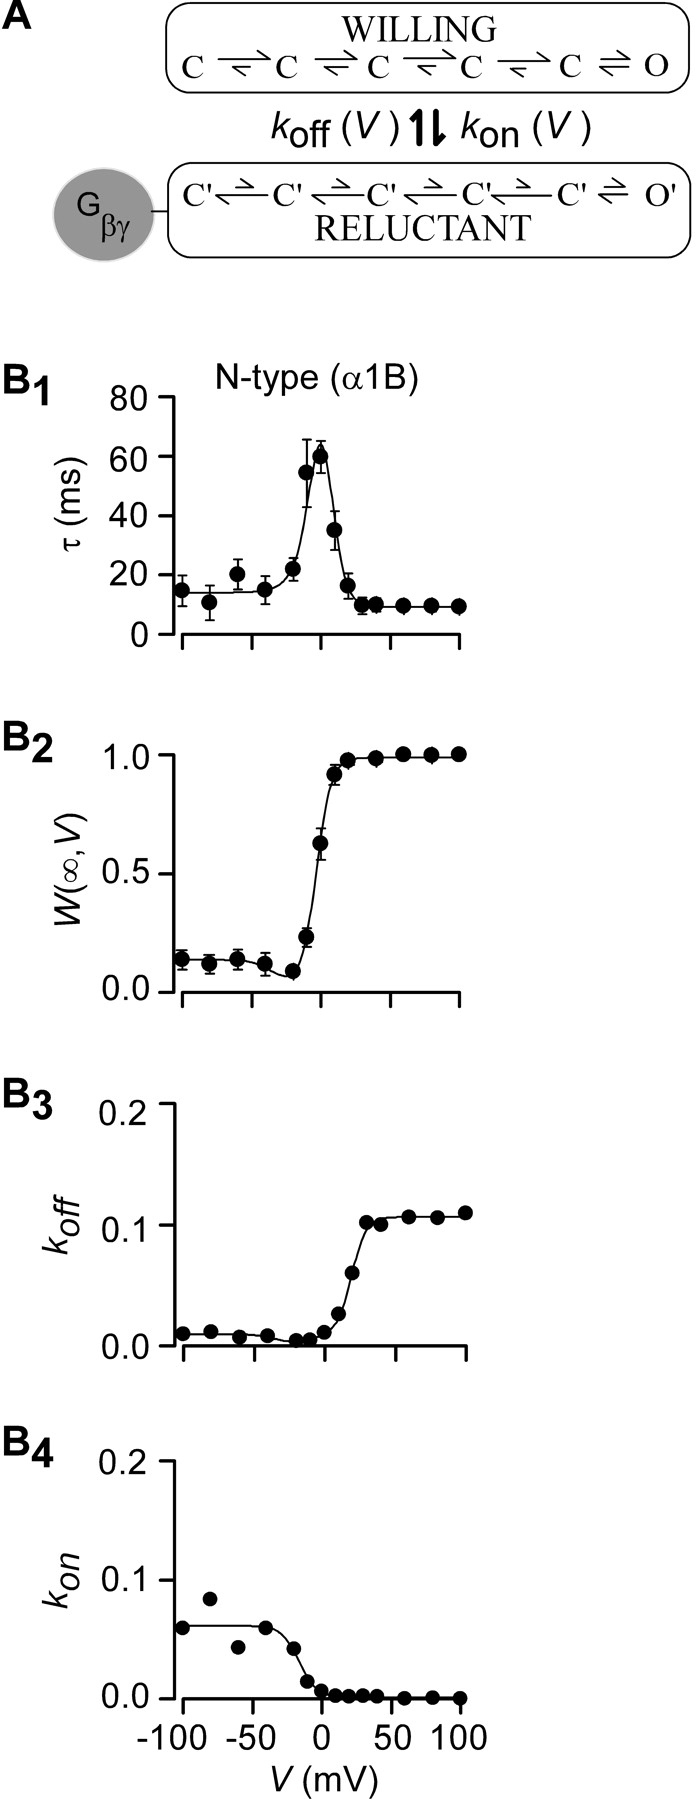
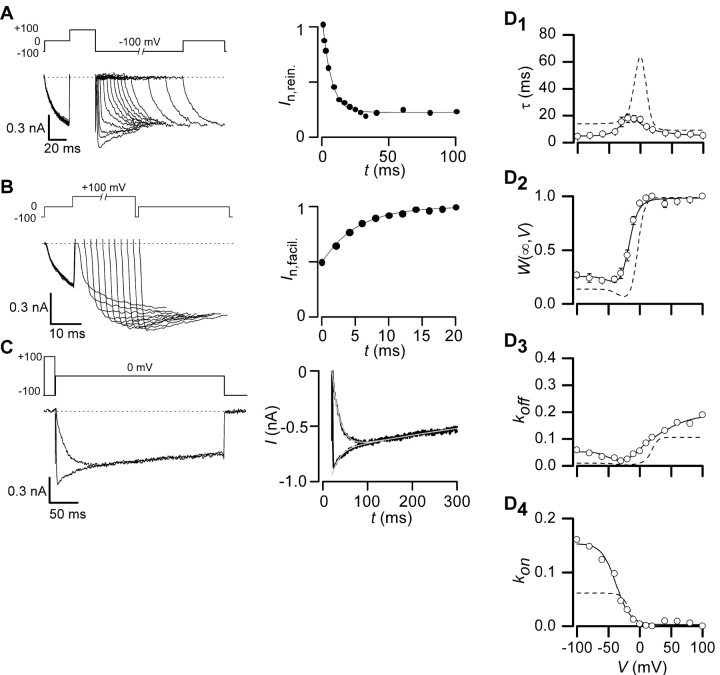
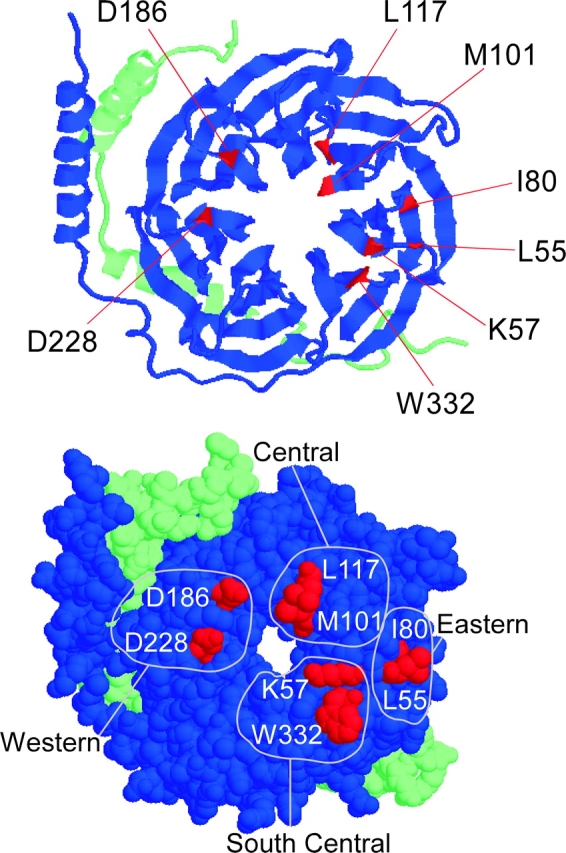
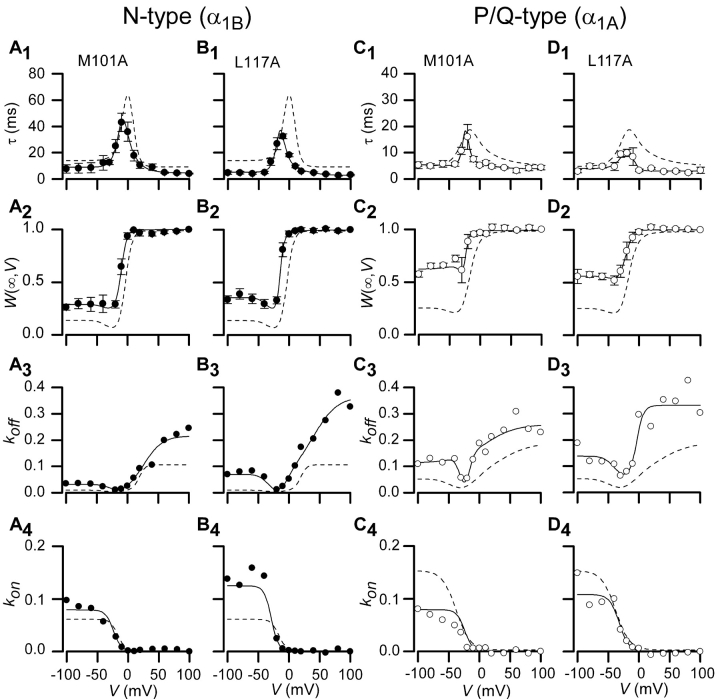
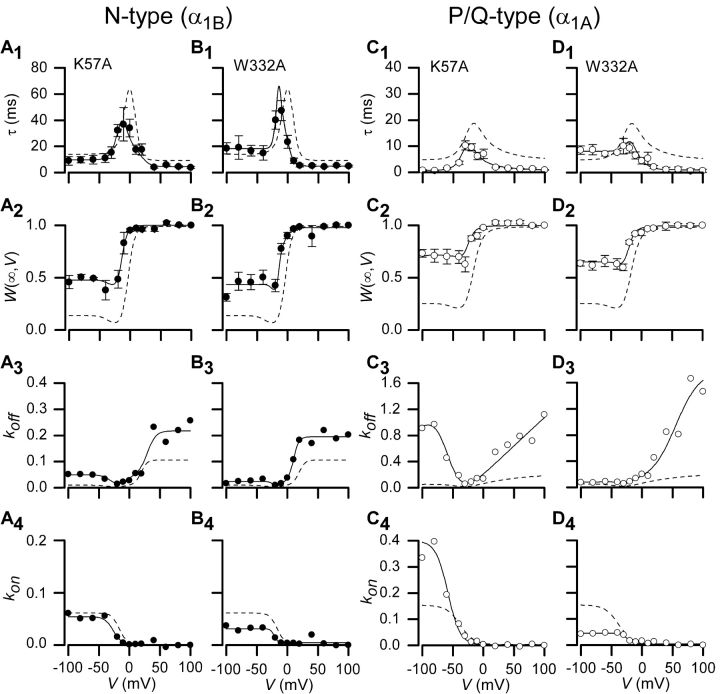
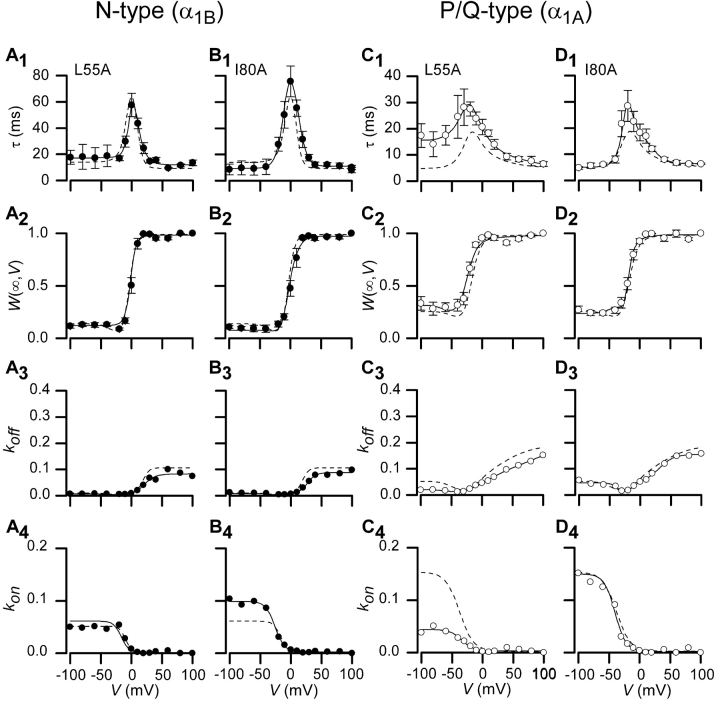
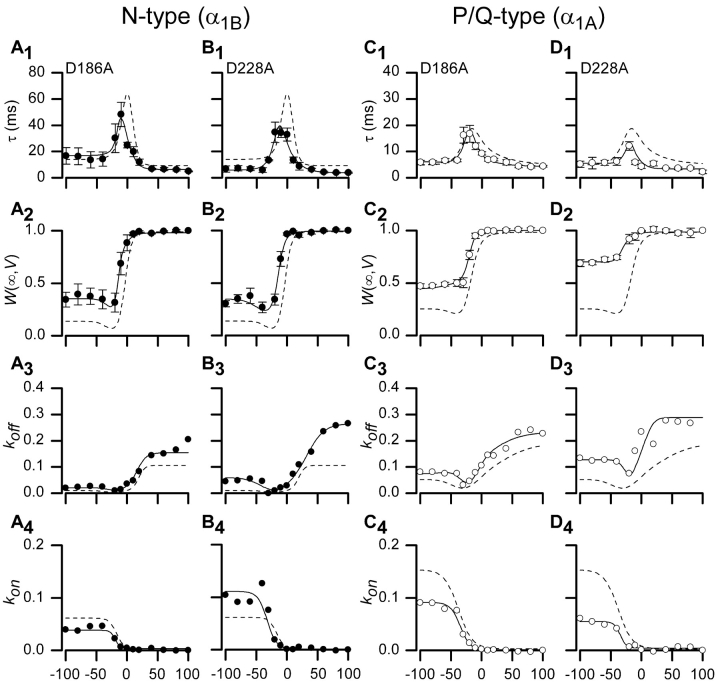
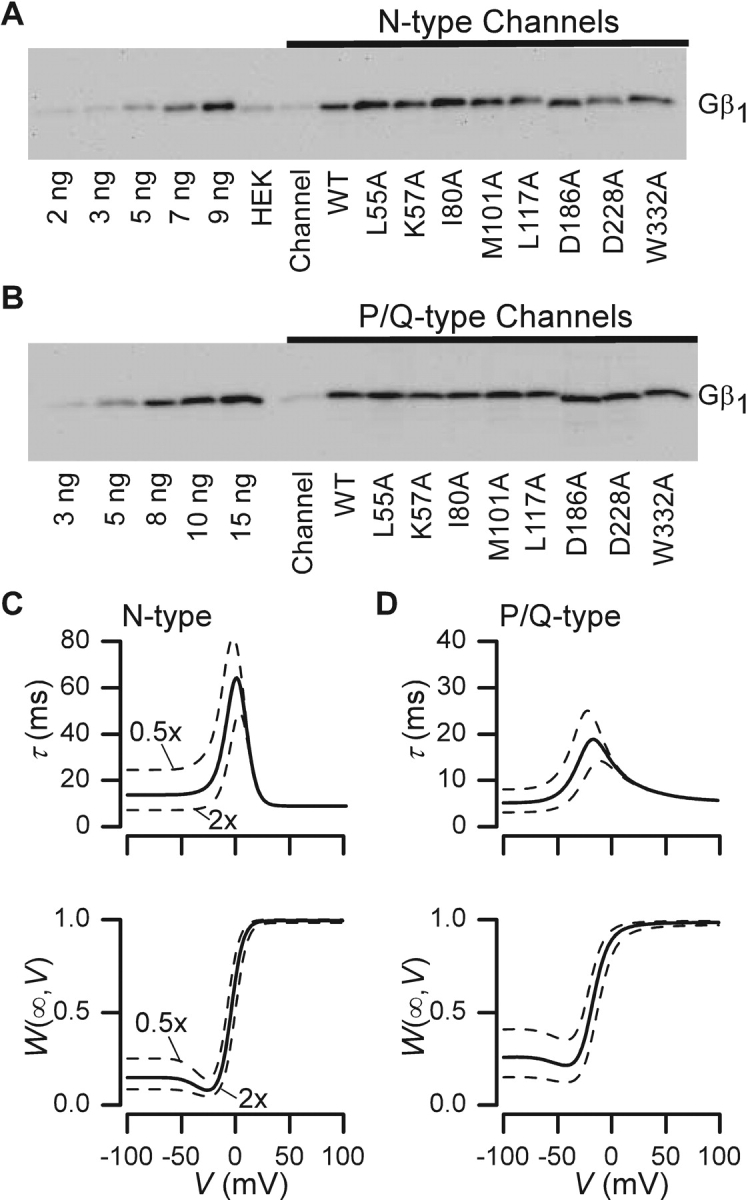
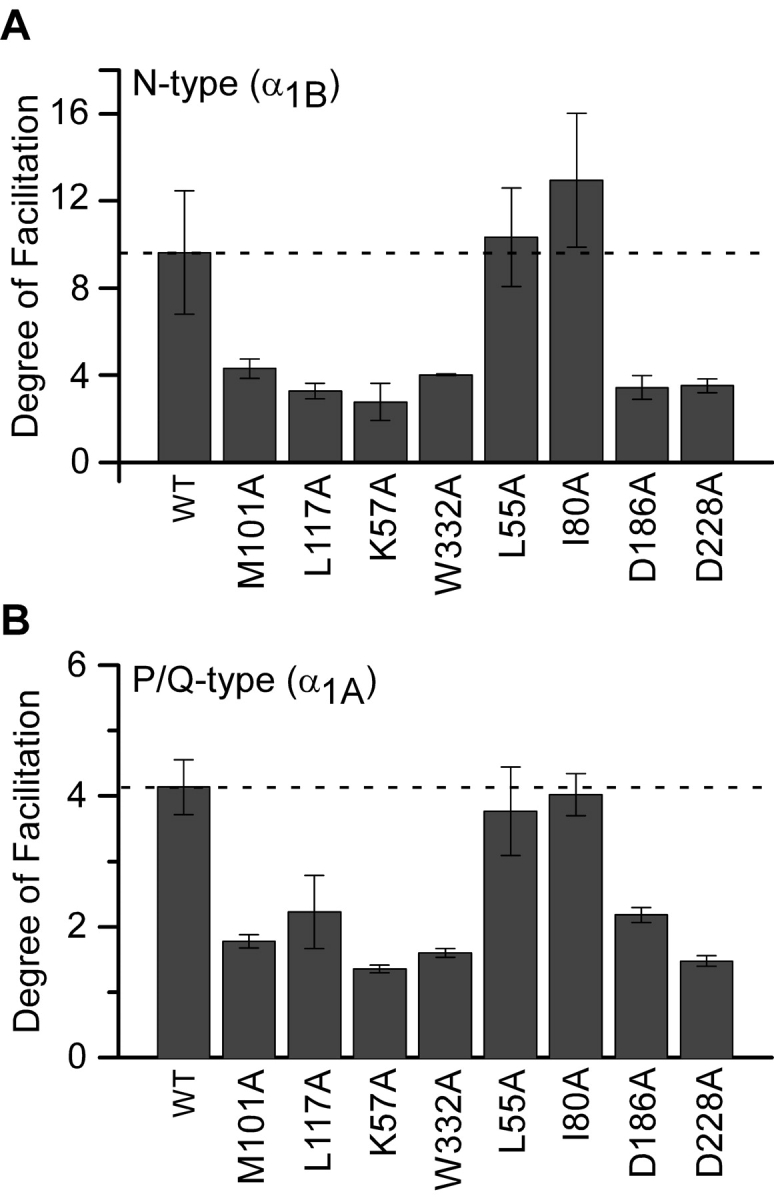
Inhibition of N- (Cav2.2) and P/Q-type (Cav2.1) calcium channels by G-proteins contribute importantly to presynaptic inhibition as well as to the effects of opiates and cannabinoids. Accordingly, elucidating the molecular mechanisms underlying G-protein inhibition of voltage-gated calcium channels has been a major research focus. So far, inhibition is thought to result from the interaction of multiple proposed sites with the Gbetagamma complex (Gbetagamma). Far less is known about the important interaction sites on Gbetagamma itself. Here, we developed a novel electrophysiological paradigm, "compound-state willing-reluctant analysis," to describe Gbetagamma interaction with N- and P/Q-type channels, and to provide a sensitive and efficient screen for changes in modulatory behavior over a broad range of potentials. The analysis confirmed that the apparent (un)binding kinetics of Gbetagamma with N-type are twofold slower than with P/Q-type at the voltage extremes, and emphasized that the kinetic discrepancy increases up to ten-fold in the mid-voltage range. To further investigate apparent differences in modulatory behavior, we screened both channels for the effects of single point alanine mutations within four regions of Gbeta1, at residues known to interact with Galpha. These residues might thereby be expected to interact with channel effectors. Of eight mutations studied, six affected G-protein modulation of both N- and P/Q-type channels to varying degrees, and one had no appreciable effect on either channel. The remaining mutation was remarkable for selective attenuation of effects on P/Q-, but not N-type channels. Surprisingly, this mutation decreased the (un)binding rates without affecting its overall affinity. The latter mutation suggests that the binding surface on Gbetagamma for N- and P/Q-type channels are different. Also, the manner in which this last mutation affected P/Q-type channels suggests that some residues may be important for "steering" or guiding the protein into the binding pocket, whereas others are important for simply binding to the channel.


Figures

F<sc>igure</sc> 1.
Figure 1.
Gβγ modulation of N-type calcium channels. (A, left) Variable duration reinhibition protocol elicited by facilitating all channels with a depolarizing prepulse to 100 mV, followed by repolarization to −100 mV for variable durations, and then measuring the test-pulse current (TP) at 0 mV (5 ms into the trace). Tail and outward currents were clipped here and throughout this figure for clarity. (A, middle) Normalized test-pulse currents plotted versus duration of the repolarization step. Single exponential fit to determine reinhibition time constant and steady-state W(∞,V), according to the equation I n,rein. = W(∞,−100) + (1 − W(∞,−100))exp[−t/τ(V)], (τ = 20.4 ms). Protocols were repeated for interpulse voltage values of −40, −60, and −80 mV (not depicted). (A, right) State diagram depicting key features of “willing-reluctant” model of G-protein modulation of calcium channels. Highlighted arrows depict vertical rate constants most relevant to reinhibition protocol. (B, left) Variable-duration prepulse protocol used to determine time course of facilitation and elicited currents are shown. (B, middle) Normalized test pulse currents were measured 5 ms into the test pulse (0 mV) and plotted versus duration of prepulse (100 mV). Single exponential fits were determined using a least squares fit method to obtain a time constant and W(∞,V) values using the following equation I n,facil. = W(∞,100) + [W(∞,−100) − W(∞,100)]exp[−t/τ(V)], (τ = 8.3 ms). Protocols were repeated for prepulse voltage values of 40, 60, and 80 mV (not depicted). (B, right) State diagram with highlighted vertical arrows reflecting rates being measured by facilitation protocol. (C, left) Step protocol, with and without prepulse, used to determine time course and steady-state level of binding for given test pulse. Test pulse in exemplar is 0 mV. Step protocols were obtained from −30 to 30 mV. (C, middle) Dual fits of traces with and without a prepulse were fit using a least squares method: I +pre = I max[W(∞,V) + (1 − W(∞,V)) e−t/ τ(V)] e−t/τinact. I -pre = I max[W(∞,−100) + (W(∞,V) − W(∞,−100)) (1 − e−t/ τ(V))] e−t/τinact; (τ = 57.0 ms). (C, right) State diagram modeling G-protein modulation with highlighted arrows depicting rates measured.
F<sc>igure</sc> 2.
Figure 2.
Measured parameters and fits for recombinant N-type channels (α1B2a2δ). (A) For a particular voltage, willing-reluctant interchange is modeled as a single upward and downward rate. (B1 and B2) Time constants, τ(V), and fraction of channels in the willing mode, W(∞,V), were collected using protocols described in Fig. 1. Fits were obtained using Eqs. 1–5 and simultaneously fitting both parameters using least squares protocol. (B3) Off rates, k off(V), were determined by combining Eqs. 1 and 2 such that: k off (V) = W(∞,V)/τ(V). The smooth fit was obtained by plotting Eq. 5 using parameters determined with fits from parts B1 and B2. (B4) The on rates, k on(V), were also determined by combining Eqs. 1 and 2 where: k on(V) = (1 − W(∞,V))/τ(V). Fits were obtained by inserting the values determined in B1 and B2 into Eq. 4. All concentration values, [Gβγ], for this figure and all following figures are set to one, assuming that concentration on average is equal.
F<sc>igure</sc> 3.
Figure 3.
Exemplar traces and parameter fits shown for P/Q-type channels. (A, left) Voltage reinhibition protocol as shown in Fig. 1 with a test pulse voltage of −10 mV and exemplar traces collected at −100 mV. (A, right) Peak currents from traces shown on left were normalized and shown versus duration of interpulse to −100 mV. Fits were obtained by using the same equations as in Fig. 1 (τ = 6.3 ms). (B, left) Voltage facilitation protocol and exemplar traces shown for P/Q-type channels at 100 mV. (B, right) Peak currents were normalized and shown versus length of the prepulse. Fits were obtained using a single exponential (τ = 5.2 ms). (C, left) Step protocol and exemplar traces shown for P/Q-type channels at −10 mV. (C, right) Dual fits are shown using traces with and without a prepulse (τ(−10) = 17.9 ms, W(∞,−10) = 0.789). (D1 and D2) Time constants, τ(V), and the fraction of channels in willing mode, W(∞,V), collected are shown along with fits using same equations that were used in Fig. 2. (D3 and D4) Fits for on and off rates (k on(V) and k off(V)) determined are shown along with calculated k on(V) and k off(V). Dashed lines represent N-type channel fits.
F<sc>igure</sc> 4.
Figure 4.
Crystal structure of Gβγ with mutated residues highlighted. (Top) Ribbon model of Gβγ is shown with its Gα binding surface fully exposed. The green strand is Gγ and the blue is Gβ. The NH2 termini of each are in the upper left hand corner. The COOH terminus of Gβ is located on the end of the β stand next to the W332 residue. The COOH terminus of Gγ is in the lower right-hand corner. Residues studied are highlighted in red. (Bottom) Space fill model of Gβγ. Residues are divided into four regions based on their location according to the full set of residues that interact with Gα.
F<sc>igure</sc> 5.
Figure 5.
Measured parameters and fits for Gβ1 mutations M101A and L117A. Time constants, τ(V), fraction of channels in willing mode, W(∞,V), and on and off rates shown along with fits for two mutations found on the central region of Gβ1, M101A, and L177A. N-type channel data is shown in A and B; P/Q-type channel data is shown in C and D. Dashed lines represent wild-type Gβ1 data for each particular channel type. Format identical to Fig. 3, D1–D4.
F<sc>igure</sc> 6.
Figure 6.
Measured parameters and fits for Gβ1 mutations K57A and W332A. Time constants, τ(V), fraction of channels in willing mode, W(∞,V), and on and off rates are shown along with fits for two mutations found on south-central locus of Gβ1, K57A and W332A. N-type channel data is shown in A and B; P/Q-type channel data is shown in C and D. Dashed lines represent wild-type Gβ1 data for each particular channel type. Format identical to Fig. 3, D1–D4.
F<sc>igure</sc> 7.
Figure 7.
Measured parameters and fits for Gβ1 mutations L55A and I80A. Time constants, τ(V), fraction of channels in willing mode, W(∞,V), and on and off rates are shown along with fits for two mutations found on the eastern zone of Gβ1, L55A and I80A. N-type channel data is shown in A and B; P/Q-type channel data is shown in C and D. Dashed lines represent wild-type Gβ1 data for each particular channel type. Format identical to Fig. 3, D1–D4.
F<sc>igure</sc> 8.
Figure 8.
Measured parameters and fits for Gβ1 mutations D186A and D228A. Time constants, τ(V), fraction of channels in willing mode, W(∞,V), and on and off rates are shown along with fits for two mutations found on the western region of Gβ1, D186A and D228A. N-type channel data is shown in A and B; P/Q-type channel data is shown in C and D. Dashed lines represent wild-type Gβ1 data for each particular channel type. Format identical to Fig. 3, D1–D4.
F<sc>igure</sc> 9.
Figure 9.
Western blots assaying Gβ expression. (A) Blots shown are for N-type calcium channel (α1B2a2δ) expressed alone, or coexpressed with wild-type or mutant Gβ1. Samples were obtained from the membrane fraction of cells. The soluble fraction gave far weaker signals. The first five lanes contain varying levels of purified, bovine Gβ1 to demonstrate that samples are in the linear range. “HEK” is HEK 293 cell lysates that have undergone calcium phosphate transfection using only cDNA encoding T antigen. “Channel” identifies extracts from cells transfected with only channel subunits. All other lanes are N-type channel subunits expressed with Gγ2 and either wild-type or mutant Gβ1, as labeled. Mutations D186A and D228A traveled slightly faster than other Gβs expressed, due to the change in charge that occurs with alanine mutation. All lanes were quantified based on band density and compared with the controls. Lanes with overexpressed Gβ (wild-type or mutant) averaged 9.15 ng with a standard deviation of 2.34. (B) Blots for wild-type and mutant Gβ1 coexpressed with P/Q-type calcium channels. Again, various levels of purified Gβ1 are shown in the first five lanes. The “channel” lane shows lysates from cells transfected with only the P/Q-type channel subunits (α1A2a2δ). Lanes with overexpressed Gβ (wild-type or mutant) averaged 10.63 ng with a standard deviation of 1.56. (C) Solid curves reproduce fits for modulation of N-type channels by wild-type Gβγ, taken from Fig. 2, B1 and B2. Dashed lines represent the simulated changes that would occur when G-protein concentration is increased or decreased by a factor of two, holding all other parameters fixed. (D) Analogous sensitivity analysis for modulation of P/Q-type channels by wild-type Gβγ, with solid curve fits reproduced from Fig. 3, D1 and D2, and format identical to that in C. Again, dashed lines represent the simulated changes that would occur when G-protein concentration is increased or decreased by a factor of two, holding all other parameters constant.
F<sc>igure</sc> 10.
Figure 10.
Degree of facilitation measured for N-and P/Q-type channels. (A) The degree of facilitation calculated (1/W(∞,−100 mV)), for N-type channels expressed with Gβ1 wild-type and with each mutant. (B) The degree of facilitation, calculated in same manner as A, for P/Q-type channels expressed with wild-type Gβ1 and with each mutant.

Similar articles

Cited by

References

    1. Albsoul-Younes, A.M., P.M. Sternweis, P. Zhao, H. Nakata, S. Nakajima, Y. Nakajima, and T. Kozasa. 2001. Interaction sites of the G protein β subunit with brain G protein-coupled inward rectifier K+ channel. J. Biol. Chem. 276:12712–12717. - PubMed
    1. Arnot, M.I., S.C. Stotz, S.E. Jarvis, and G.W. Zamponi. 2000. Differential modulation of N-type 1B and P/Q-type 1A calcium channels by different G protein subunit isoforms. J. Physiol. 527:203–212. - PMC - PubMed
    1. Artim, D.E., and S.D. Meriney. 2000. G-protein-modulated Ca(2+) current with slowed activation does not alter the kinetics of action potential-evoked Ca(2+) current. J. Neurophysiol. 84:2417–2425. - PubMed
    1. Atkins, P. 1998. Chapter 27: Molecular reaction dynamics. Physical Chemistry. W.H. Freeman and Company, New York. 830–843.
    1. Barrett, C.F., and A.R. Rittenhouse. 2000. Modulation of N-type calcium channel activity by G-proteins and protein kinase C. J. Gen. Physiol. 115:277–286. - PMC - PubMed

Publication types

Substances