. 2003 Jun;121(6):583-98.
doi: 10.1085/jgp.200308812.

Saxitoxin is a gating modifier of HERG K+ channels

Affiliations

Saxitoxin is a gating modifier of HERG K+ channels

Jixin Wang et al. J Gen Physiol. 2003 Jun.

Abstract

Potassium (K+) channels mediate numerous electrical events in excitable cells, including cellular membrane potential repolarization. The hERG K+ channel plays an important role in myocardial repolarization, and inhibition of these K+ channels is associated with long QT syndromes that can cause fatal cardiac arrhythmias. In this study, we identify saxitoxin (STX) as a hERG channel modifier and investigate the mechanism using heterologous expression of the recombinant channel in HEK293 cells. In the presence of STX, channels opened slower during strong depolarizations, and they closed much faster upon repolarization, suggesting that toxin-bound channels can still open but are modified, and that STX does not simply block the ion conduction pore. STX decreased hERG K+ currents by stabilizing closed channel states visualized as shifts in the voltage dependence of channel opening to more depolarized membrane potentials. The concentration dependence for steady-state modification as well as the kinetics of onset and recovery indicate that multiple STX molecules bind to the channel. Rapid application of STX revealed an apparent "agonist-like" effect in which K+ currents were transiently increased. The mechanism of this effect was found to be an effect on the channel voltage-inactivation relationship. Because the kinetics of inactivation are rapid relative to activation for this channel, the increase in K+ current appeared quickly and could be subverted by a decrease in K+ currents due to the shift in the voltage-activation relationship at some membrane potentials. The results are consistent with a simple model in which STX binds to the hERG K+ channel at multiple sites and alters the energetics of channel gating by shifting both the voltage-inactivation and voltage-activation processes. The results suggest a novel extracellular mechanism for pharmacological manipulation of this channel through allosteric coupling to channel gating.


Figures

F<sc>igure</sc> 1.
Figure 1.
STX effects on hERG K+ channels. hERG K+ current traces were recorded during a voltage clamp step to either −40 (A and B) or 0 mV (C and D), followed by a step to −70 mV to record K+ current tails. Shown are K+ currents measured in control or during steady-state exposure to 3 and 10 μM STX. (D) Normalized K+ currents scaled to control at the end of the voltage step to 0 mV in order to compare the kinetic changes caused by STX. (E) Voltage-activation curves where K+ current is normalized to the maximum outward current in control. (F) Tail currents in STX normalized to the control tail maximum. Means ± SEM of from 4–6 cells.
F<sc>igure</sc> 2.
Figure 2.
Concentration dependence of suppression of hERG K+ currents at different membrane potentials. hERG K+ currents were normalized to control before STX exposure at the membrane potential indicated. Data were fit with the Hill equation to estimate an EC50 and a Hill slope. (B) Voltage activation curves from peak tail currents. Outward tail currents measured at −70 mV after a voltage clamp step to the potential indicated were normalized to unity and fit with the Boltzmann equation to estimate the membrane potential for half maximal activation of the channels, and the energetic cost of opening the channels in the presence of different concentrations of STX. Full recovery was observed upon washout of STX.
F<sc>igure</sc> 3.
Figure 3.
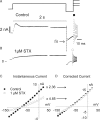
Effects of STX on open hERG K+ channels. K+ currents through open The hERG channels were estimated as shown in A (control) and B (1 μM STX). The cells were held at −80 mV. A 2-s step to 50 mV was used to activate hERG K+ channels, followed by a 12.5-ms step to −100 mV to recover channels from the inactivated to the open state, then step potentials between 100 and −140 mV were applied to record K+ current through open hERG channels. Note the change in time scale. On the right side of A and B, current traces after the 2-s condition pulse are shown at the expanded time scale. The amount of hERG K+ current deactivation during 12.5 ms at −100 mV was extrapolated to the time of the voltage transition to correct for deactivation before the test step. The kinetic correction factor described in Johnson et al. (1999a) was used to correct for the underestimate of the peak current due to deactivation during the 12.5-ms recovery period. The I-V relationship of instantaneous hERG K+ current before correction is shown in C. The I-V relationship corrected for hERG K+ current is shown in D. [Ca2+]o = 0.1 mM, 36°C.
F<sc>igure</sc> 4.
Figure 4.
Voltage ramp analysis of the effects of STX on hERG K+ channels. Membrane potential was ramped across the voltage activation range of the channels. The left panels show the effects of STX. The right panel shows the effects of MK499, a hERG pore blocker. (Top) K+ currents recorded during a ramp protocol in control or drug (concentrations shown). (Middle) Ratio of ramp current in drug to control (Idrug/Icontrol). The best fit Boltzmann estimated from tail currents is shown also for reference. (Bottom) Drug-sensitive K+ current estimated by subtracting the K+ current recorded in drug from the K+ current in the absence of drug.
F<sc>igure</sc> 5.
Figure 5.
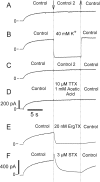
Controls for rapid solutions changes: effects on hERG K+ channels. Test solutions were delivered to the channels by a rapid solution exchange device. Cells were clamped at −80 mV and stepped to a membrane potential of −30 mV for 25 s. During this voltage step, a programed fast step perfusion device was used to apply various agents at t = 10 s and a wash solution at t = 20 s. Shown are the following solution changes (A) bath solution (control); (B) 40 mM KCl; (C) bath solution (wash, same as 1); (D) 10 μM TTX + 1 mM acetic acid (STX excipiant); (E) 20 nM rErgtoxin; (F) 3 μM STX. Similar results were obtained on a total of four cells. [Ca2+]o = 0.1 mM, 23°C.
F<sc>igure</sc> 6.
Figure 6.
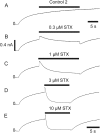
Rapid application of STX: kinetic analysis and concentration dependence of increase and decrease of hERG channel K+ currents. STX was delivered to the cells by a fast-step dual channel perfusion device. Cells were voltage clamped to −80 mV and stepped to −40 mV for 38 s in control (A), 0.3 (B), and 1 μM STX (C) or 25 s for 3 (D), and 10 μM STX (E). During this voltage step, a rapid solution exchange occurred at 10 s indicated by the bar above each record. A wash solution started at 30 s (control, 0.3, 1 μM STX) or at 20 s (3 and 10 μM STX). [Ca2+]o = 0.1 mM, 23°C.
F<sc>igure</sc> 7.
Figure 7.
Summary of concentration dependence of increases and decrease of K+ currents. The fractional increase and decrease of K+ current at each concentration of STX is plotted as a function of STX concentration and was fitted with Eq. 4. The solid curves represent best fits of Eq. 4 with apparent EC50s were 0.27 and 0.47 μM, respectively.
F<sc>igure</sc> 8.
Figure 8.
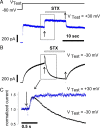
Dual effect of STX on K+ current depending upon membrane potential. The cell was held at −80 mV and stepped alternatively to −30 or 30 mV for 30 s. During this long depolarization after 10 s, STX was applied for 10 s and washed out. (A) Membrane potential step to 30 mV; (B) membrane potential step to −30 mV; (C) superposition of K+ currents at each voltage step. The current data in the gray boxed areas in A and B were scaled to be 1 immediately before STX application. (D) Wash out of STX at 30 mV. (E) Wash out of STX at −30 mV. In D and E, the time axis was translated so that the beginning of the washout corresponded with t = 0. The solution switch electrical artifact can be seen as noise on the current trace. The application and removal of STX is also indicated by the arrows.
F<sc>igure</sc> 9.
Figure 9.
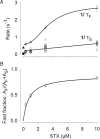
(A) Concentration dependence of rates of change caused by STX. The time course of STX-induced K+ current decrease at −40 mV was fitted to a two-exponential function to estimate the rate of change and the fractional amplitude. The rates of change in current (1/τ) were derived from the two time constants of the exponential fits (τF and τS). (B) The fractional amplitude (AF) of the faster component associated with τF is plotted as a function of STX concentration. The control rates of gating in the absence of STX are plotted as solid symbols for reference.
F<sc>igure</sc> 10.
Figure 10.
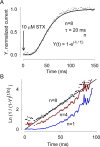
Analysis of the increase of hERG K+ currents after rapid application of 10 μM STX during a long (30 s) voltage clamp step to −40 mV. Justification for STX-channel stoichiometry ≥4. Data were scaled to a maximum of 1 at steady-state and fit with an exponential function compatible with n independent binding sites. Y (t) = (1 − e (−t/τ))n. Alternatively, the normalized data (Y(t)) were transformed with various roots of the equation, ln(1/(1 − Y)1/ n and plotted as a function of time B. After this transformation, the data should be linearized when the root (1/n) matches the appropriate number of sites. Transformations with n = 1 or n =4 resulted in nonlinear datasets, if n = 8, then the data were linearized.
F<sc>igure</sc> 11.
Figure 11.
Analysis of the increase of hERG K+ currents following rapid application of STX. (A) Rapid application of 1 μM STX. The best fit of a higher order exponential function [y(t) = A · (1 − e (−t/τ))n + C] is shown superimposed. The best fit power (n) was 4. The residual error between the fit and the data is shown in B. C and D show the increase of hERG K+ currents following rapid application of 3 and 10 μM STX, respectively. Also shown are evaluation of the above equation with different values of the parameter, n. In C (3 μM STX), a value of n >4 fit the data. In D at a higher concentration of STX (10 μM), n = 8 appeared to fit to the data. [Ca2+]o = 0.1 mM, 23°C.
F<sc>igure</sc> 12.
Figure 12.
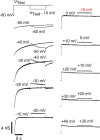
A 10 mV negative voltage step mimicked STX effect on hERG K+ currents. No STX was used in this experiment. This voltage clamp protocol consists of two episodes. The first episode was a 25-s test pulse (V1st) that changed from −50 to 40 mV in 10-mV increments. During the second episode, the 25-s duration was divided into three parts: 10, 10, and 5 s. The first 10 s and the last 5 s were set to the same membrane potential voltage as V1st. During the middle 10 s the membrane potential was stepped negative by 10 mV relative to V1st. hERG K+ currents were converted to chord conductances by dividing the amplitude of the current with its corresponding driving force (Vm- Vrev). The reversal potential (Vrev) used for hERG K+ channels was −92 mV. [Ca2+]o = 0.1 mM, 23°C.
F<sc>igure</sc> 13.
Figure 13.
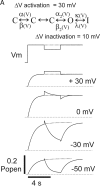
A simple K+ channel kinetic model predicts STX effects through shifting activation and inactivation gating. Simulation of STX action through modification of voltage-dependent rate constants. The model employed was that of Johnson et al. (1999a) as modified from Wang et al. (1997). The effects of STX were simulated by perturbing the voltage-dependent rate constants governing activation (α and β) and inactivation (κ and λ). A 30 mV (α and β) and a 10 mV (κ and λ) shift (ΔV) was added to the voltage-dependent term of the rate constant master equations to mimic the effect of STX. The top panel shows the voltage clamp protocol and the perturbation (ΔV) to the rate equations is indicated as a small step. As indicated schematically in the top of A, the rate constant equations were temporarily modified for 3 s during the voltage step, beginning 3 s after the step initiation. The applied voltage and hence driving force were not actually changed. The dotted lines in the Popen traces indicate the control behavior in the absence of the shift. The model is shown schematically where α, β, κ, and λ are voltage-dependent rate constants defined by the following equations. Closed, open, and inactivated (closed also) states are symbolized as C, O, and I, respectively. α = αo exp [z δ e (V + DVa) / k B / T] forward; β = βo exp [ z (1− δ) e (V + DVa)/k B /T] reverse; κ = κo exp [z δ e (V + DVi)/k B /T] forward; λ = λo exp [ z (1− δ) e (V + DVi) / k B / T] reverse. α is the forward rate constant (s−1); αo is value of α in the absence of an electric field. zδ the gating charge and the fraction of the field it senses, e the electron charge, kB is Boltzmann's constant, T is the absolute temperature, V is membrane potential, and ΔV is a bias potential that can be applied to the equations. The effect is to shift the log linear rate constant relationship along the voltage axis.

Similar articles

Cited by

References

    1. Anumonwo, J.M., J. Horta, M. Delmar, S.M. Taffet, and J. Jalife. 1999. Proton and zinc effects on HERG currents. Biophys. J. 77:282–298. - PMC - PubMed
    1. Armstrong, C.M. 1971. Interaction of tetraethylammonium ion derivatives with the potassium channels of giant axons. J. Gen. Physiol. 58:413–437. - PMC - PubMed
    1. Campbell, D.T., and B. Hille. 1976. Kinetic and pharmacological properties of the sodium channel of frog skeletal muscle. J. Gen. Physiol. 67:309–323. - PMC - PubMed
    1. Changeux, J.P., and S.J. Edelstein. 1998. Allosteric receptors after 30 years. Neuron. 21:959–980. - PubMed
    1. Chiba, S., and K. Hashimoto. 1969. Ventricular fibrillation induced by saxitoxin into the AV node artery and its prevention by phenoxybenzamine. Tohoku J. Exp. Med. 99:103–104. - PubMed