. 2003 Jun;121(6):615-28.
doi: 10.1085/jgp.200308813.

Properties of single voltage-gated proton channels in human eosinophils estimated by noise analysis and by direct measurement

Affiliations

Properties of single voltage-gated proton channels in human eosinophils estimated by noise analysis and by direct measurement

Vladimir V Cherny et al. J Gen Physiol. 2003 Jun.

Abstract

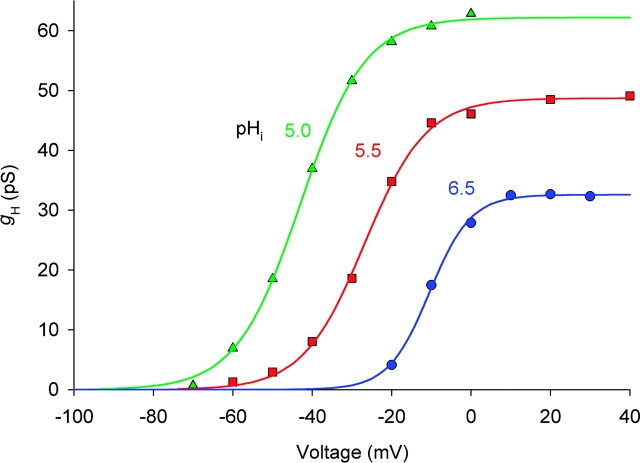
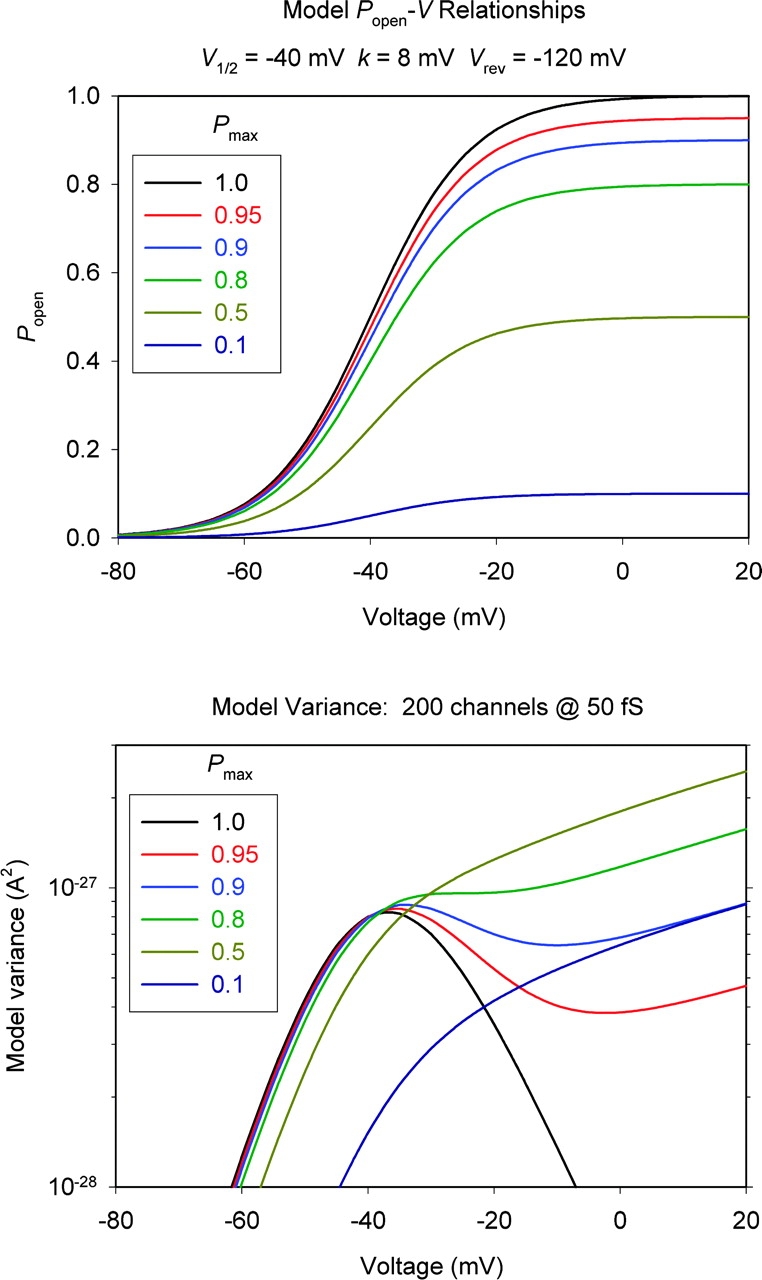
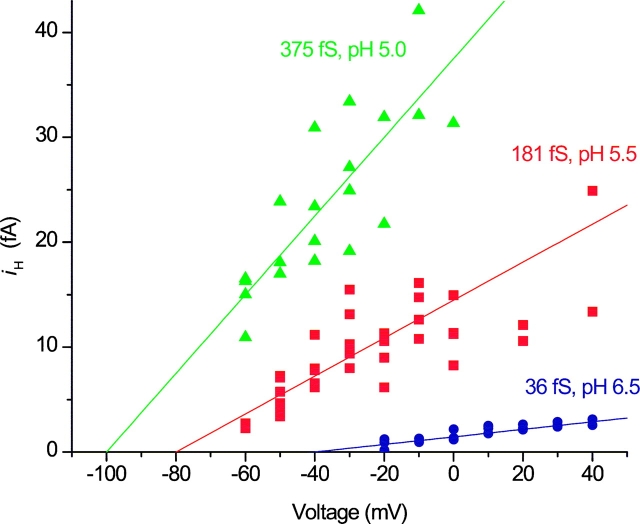
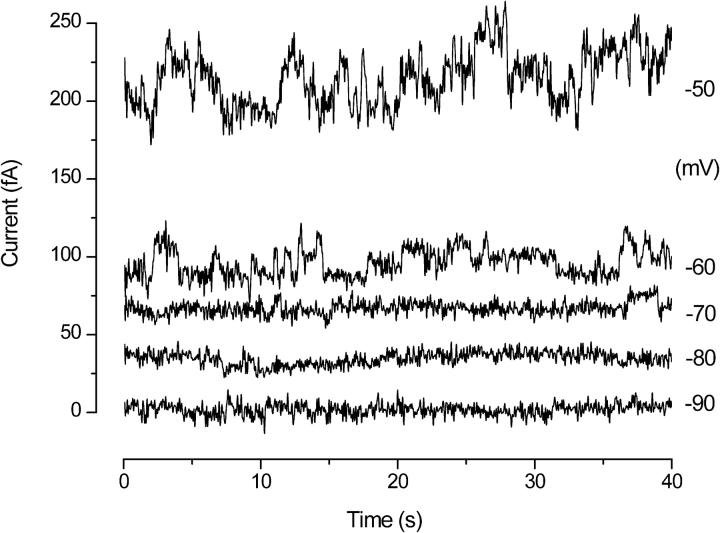
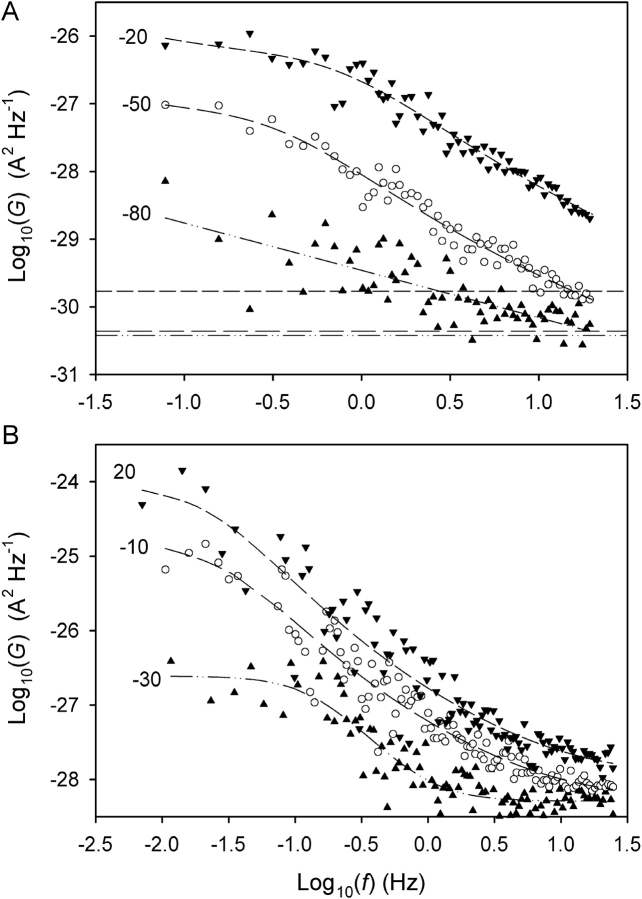
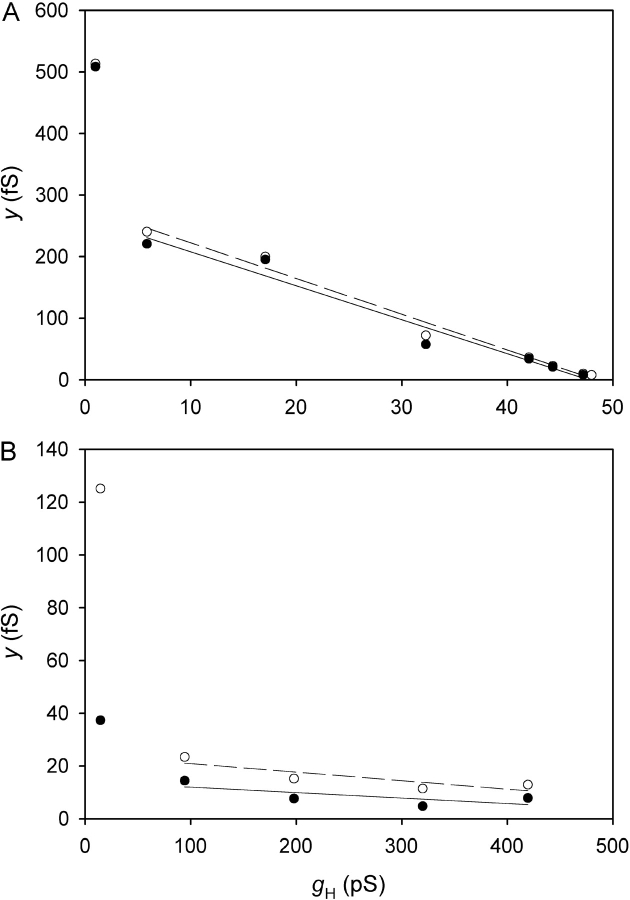
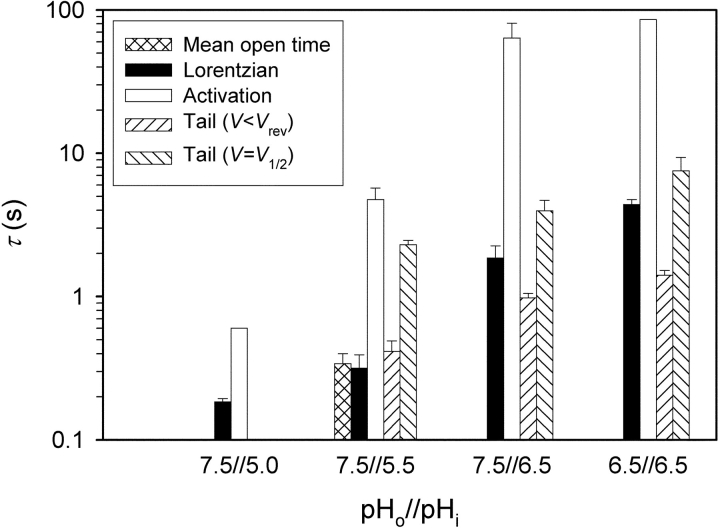
Voltage-gated proton channels were studied under voltage clamp in excised, inside-out patches of human eosinophils, at various pHi with pHo 7.5 or 6.5 pipette solutions. H+ current fluctuations were observed consistently when the membrane was depolarized to voltages that activated H+ current. At pHi < or = 5.5 the variance increased nonmonotonically with depolarization to a maximum near the midpoint of the H+ conductance-voltage relationship, gH-V, and then decreased, supporting the idea that the noise is generated by H+ channel gating. Power spectral analysis indicated Lorentzian and 1/f components, both related to H+ currents. Unitary H+ current amplitude was estimated from stationary or quasi-stationary variance, sigmaH2. We analyze sigmaH2 data obtained at various voltages on a linearized plot that provides estimates of both unitary conductance and the number of channels in the patch, without requiring knowledge of open probability. The unitary conductance averaged 38 fS at pHi 6.5, and increased nearly fourfold to 140 fS at pHi 5.5, but was independent of pHo. In contrast, the macroscopic gH was only 1.8-fold larger at pHi 5.5 than at pHi 6.5. The maximum H+ channel open probability during large depolarizations was 0.75 at pHi 6.5 and 0.95 at pHi 5.5. Because the unitary conductance increases at lower pHi more than the macroscopic gH, the number of functional channels must decrease. Single H+ channel currents were too small to record directly at physiological pH, but at pHi < or = 5.5 near Vthreshold (the voltage at which gH turns on), single channel-like current events were observed with amplitudes 7-16 fA.


Figures

F<sc>igure</sc> 1.
Figure 1.
Effect of sample length (Δt) on estimates of the current variance (σ 2). (A) pHo//pHi 7.5//5.0, V = −30 mV; the curve is a least-squares fit of formula image with A 0 = 4.0 × 10⁻²⁷ A2, A 1 = 1.5 × 10⁻²⁶ A2, A 2 = 2.0 × 10⁻²⁷ A2, τ 1 = 1.1 s and τ 2 = 9.3 s. (B) pHo//pHi 7.5//6.5, V = 10 mV; the curve is a least-squares fit of formula image, with A 0 = 7.2 × 10⁻²⁹ A2, A 1 = 7.6 × 10⁻²⁸ A2, τ 1 = 1.3 s and B = 1.3 × 10⁻³⁰ A2 s−1. See text for details.
F<sc>igure</sc> 2.
Figure 2.
Current fluctuations occur at voltages that activate voltage-gated proton current. Families of currents at pHo 7.5 and three pHi in the same membrane patch are illustrated at the same time and current calibrations. Raw currents are shown at 20-mV intervals, as indicated, with no leak correction. The holding potential was −100 mV at pHi 5.0 and −80 mV for pHi 5.5. The currents shown were obtained at 11–46 min for pHi 6.5, 81 min for pHi 5.5, and 83 min for pHi 5.0, respectively, after patch excision. Filter was 20 Hz for all. ES-2596.
F<sc>igure</sc> 3.
Figure 3.
Steady-state g H-V relationships for the patch illustrated in Fig. 2. Chord conductance, g H, was calculated assuming V rev of −40, −80, and −100 mV, at pHi 6.5 (•), 5.5 (▪), and 5.0 (▴), respectively. Curves show best-fitting (by nonlinear least squares) Boltzmann functions: g H = g H,max {1 + exp[−(VV 1/2)/k]}−1 with midpoints (V 1/2) of −10.4, −26.9, and −43.0 mV, slope factors (k) of 5.2, 7.8, and 8.1 mV, and g H,max of 32.6, 48.7, and 62.2 pS at pHi 6.5, 5.5, and 5.0, respectively. ES-2596.
F<sc>igure</sc> 4.
Figure 4.
Voltage dependence of total variance from the same patch as Figs. 2 and 3. Symbols have the same meaning. The midpoints of the P open-voltage relationships determined as described in Fig. 7, are indicated by symbols near the X axis. The open symbols show the band-limited Lorentzian component of the σ2 in this experiment, formula image, obtained by fitting power spectra with Lorentzian plus 1/f components (as described in Fig. 10). There is divergence only at large depolarizations at pHi 5.0, where the 1/f component became significant. ES-2596.
F<sc>igure</sc> 5.
Figure 5.
Model showing the voltage dependence of variance in a simple two-state channel, for different values of P max, the maximum P open during large depolarizations. The top panel shows the assumed P open-V relationships with various P max values, as indicated. All were calculated from a Boltzmann function with midpoint, V 1/2 = −40 mV and slope factor, k = 8 mV. The bottom panel shows the variance expected for 200 channels with γH 50 fS and V rev −120 mV, assuming the various P open-V relationships plotted above. The curves were generated using Eq. 1 with I H = i H N P open = γH (VV rev) N P open.
F<sc>igure</sc> 6.
Figure 6.
Simultaneous estimation of γH and N at three pHi in the same patch and with the same symbol meanings as in Figs. 2–4. The data set includes many records and different voltages. The lines are least-squares fits of Eq. 2, in which the Y-intercept is γH and the slope is −1/N, providing the following estimates: γH 36 fS, 181 fS, and 375 fS, and N 1210, 290, and 170 for pHi 6.5, 5.5, and 5.0, respectively. ES-2596.
F<sc>igure</sc> 7.
Figure 7.
Voltage dependence of P open at pHi 6.5, 5.5, and 5.0, for the same patch as in Figs. 2–4, and 6. P open was estimated as g H/(N γ H), where the total number of channels in the patch, N, and γH were estimated from the y-gH plot (Fig. 6). Here only the last 1–2 records at each voltage are included, because earlier points were farther from steady-state. Curves show best-fitting (by nonlinear least squares) Boltzmann functions: P open = P max {1 + exp[−(VV 1/2)/k]}−1 with midpoints (V 1/2) of −11.2, −26.9, and −42.9 mV, slope factors (k) of 5.7, 7.8, and 8.3 mV, and P max of 0.78, 0.93, and 0.98 at pHi 6.5, 5.5, and 5.0, respectively. ES-2596.
F<sc>igure</sc> 8.
Figure 8.
Single H+ channel current-voltage plots in the same patch and with the same symbol meanings as in Figs. 2–4 and 6 and 7. Estimates for i H were obtained by using Eq. 1, where P open is derived from the analysis in Fig. 7, and ultimately from the estimates of γH and N obtained from the y-gH plot (Fig. 6). ES-2596.
F<sc>igure</sc> 9.
Figure 9.
Apparent single proton channel currents at pHo 7.5 and pHi 5.5. These currents were filtered at 20 Hz (8-pole Bessel) and later digitally refiltered at 10 Hz. The current scale is positioned arbitrarily. The resistance of this patch at subthreshold voltages was 5 TΩ. For clarity, each record is displaced vertically by 20 fA above its true position relative to the record underneath. ES2724.
F<sc>igure</sc> 10.
Figure 10.
Power spectra of H+ current fluctuations. Test voltages (mV) are shown next to each curve. (A) pHo = 7.5, pHi = 5.5, V threshold = −55 mV. The subthreshold data (▴) are fitted with a 1/f spectrum while the suprathreshold data sets are fitted with Lorentzian plus 1/f spectra. The latter two data sets can be fitted equally well by a Lorentzian plus white noise. The horizontal lines show the calculated sum of the spectral densities of the calculated shot noise of current flow and Johnson noise of the 50 GΩ feedback resistor in parallel with the patch resistance, which were: 3.8 × 10⁻³¹ (▴), 4.4 × 10⁻³¹ (○) and 1.7 × 10⁻³⁰ (▾) A2 Hz−1. (B) pHo = 7.5, pHi = 6.5, V threshold < −30 mV. The near-threshold data (▴) are fitted with a Lorentzian plus white noise while the other datasets are each fitted with a Lorentzian plus 1/f plus white noise. The data at −10 and 20 mV can be fitted equally well with a 1/f spectrum plus white noise, but the exponents (m) on f are significantly greater than unity (1.29 ± 0.05 and 1.37 ± 0.07, respectively). The sum of Johnson- and shot-noise spectral densities were 1.3 × 10⁻³⁰ (▴), 8.4 × 10⁻³⁰ (○) and 2.0 × 10⁻²⁹ (▾) A2 Hz−1 (too small to show on this scale). Data in A and B are from two different patches (ES-2596, ES-2579).
F<sc>igure</sc> 11.
Figure 11.
The Lorentzian variance (▴) and the band-limited 1/f (○) and white noise (▾) variances were determined from fitted power spectra (Fig. 10) and are plotted here against membrane voltage (V). The white noise and 1/f variances were calculated over the interval [f 0, f N], where f 0 is the lowest frequency in the spectrum and f N is the Nyquist frequency. On average, the band-limited Lorentzian variance (open symbols in Fig. 4) was ∼10% less than the total Lorentzian variance (which is plotted here). The dashed lines without symbols show the calculated sum of the Johnson- and shot-noise variances (see Fig. 10) over the interval [f 0, f N]. (A) pHo = 7.5, pHi = 5.5, V threshold = −55 mV; (B) pHo = 7.5, pHi = 6.5, V threshold < −30 mV. Same two patches as in Fig. 10. In A, 1/f noise was not detectable between −10 and 20 mV; presumably it was masked by the Lorentzian. On the other hand, only 1/f noise was detected at 40 mV; apparently Lorentzian noise had fallen to undetectable levels, suggesting a P max value close to unity. In B, no peak is observed in the Lorentzian variance, suggesting P max ≤ 0.8 (see text and Fig. 5).
F<sc>igure</sc> 12.
Figure 12.
Examples of y-g H plots with y calculated using the total variance (○, dashed line) or the Lorentzian variance (•, solid line). See Eqs 2 and 3. (A) pHo 7.5, pHi 5.5; (B) pHo 7.5, pHi 6.5. Same two patches as in Figs. 10 and 11. Regression lines were fitted after omitting the outliers near g H = 0. In B, the slopes are not statistically significant, illustrating the difficulty of estimating N (= −1/slope) at pHi 6.5. However, more reliable estimates of N were obtained in some cases (e.g., Fig. 6).
F<sc>igure</sc> 13.
Figure 13.
Comparison of the Lorentzian time constants (τ L), single-channel mean open times, and time constants of H+ current activation (τ act) and deactivation (τ tail) at various pHo and pHi. Mean open time is the global mean of data at −60 mV from five patches (n = 9–33 in each patch), estimated from current records like those in Fig. 9, in which apparently discrete single-channel events occurred near V threshold, all filtered at 10–20 Hz. τ act was determined by fitting the function I = I max [1 − exp(−t/τ act)] to I(t) curves such as those in Fig. 2 (top two panels). Mean values of τ act for P open = 0.5P max are compared with mean values of τ L (which showed no consistent dependence on P open). Bars show standard errors from 2–4 patches; no error bars indicate only one patch was available. τ tail at V < V rev was determined by fitting a single exponential to tail currents recorded ∼10 mV negative to V rev (mean ± SE, n = 8–18 for each pH). Also shown are τ tail values extrapolated to the midpoint voltage of the g H-V relationship, assuming exponential voltage dependence with a slope of 40 mV/e-fold change in τ tail.

Similar articles

Cited by

References

    1. Benndorf, K. 1994. Properties of single cardiac Na channels at 35°C. J. Gen. Physiol. 104:801–820. - PMC - PubMed
    1. Bernheim, L., R.M. Krause, A. Baroffio, M. Hamann, A. Kaelin, and C.-R. Bader. 1993. A voltage-dependent proton current in cultured human skeletal muscle myotubes. J. Physiol. 470:313–333. - PMC - PubMed
    1. Bezrukov, S.M., and M. Winterhalter. 2000. Examining noise sources at the single-molecule level: 1/f noise of an open maltoporin channel. Phys. Rev. Lett. 85:202–205. - PubMed
    1. Byerly, L., R. Meech, and W. Moody. 1984. Rapidly activating hydrogen ion currents in perfused neurones of the snail, Lymnaea stagnalis. J. Physiol. 351:199–216. - PMC - PubMed
    1. Byerly, L., and Y. Suen. 1989. Characterization of proton currents in neurones of the snail, Lymnaea stagnalis. J. Physiol. 413:75–89. - PMC - PubMed

Publication types