

UVA-induced cyclobutane pyrimidine dimers form predominantly at thymine-thymine dipyrimidines and correlate with the mutation spectrum in rodent cells
- PMID: 12771205
- PMCID: PMC156735
- DOI: 10.1093/nar/gkg402
UVA-induced cyclobutane pyrimidine dimers form predominantly at thymine-thymine dipyrimidines and correlate with the mutation spectrum in rodent cells
Abstract
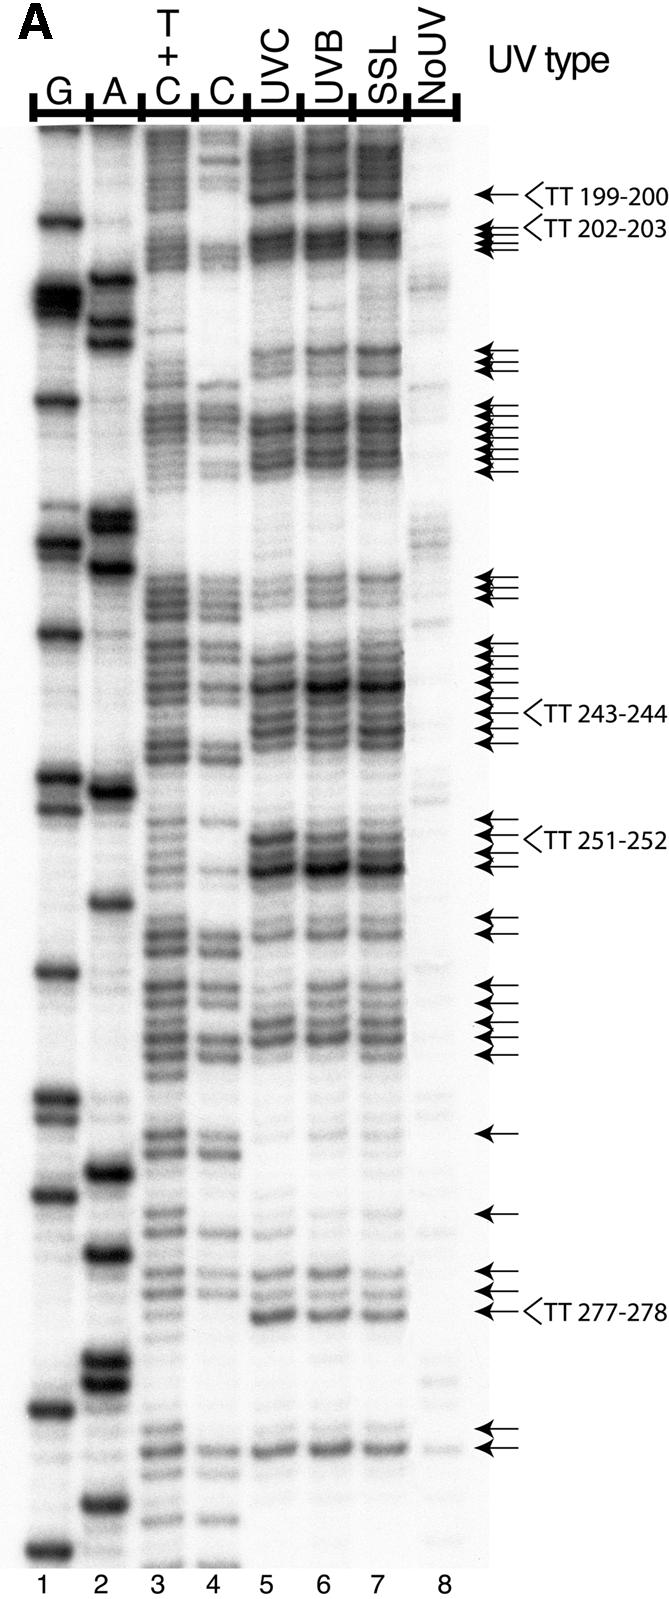
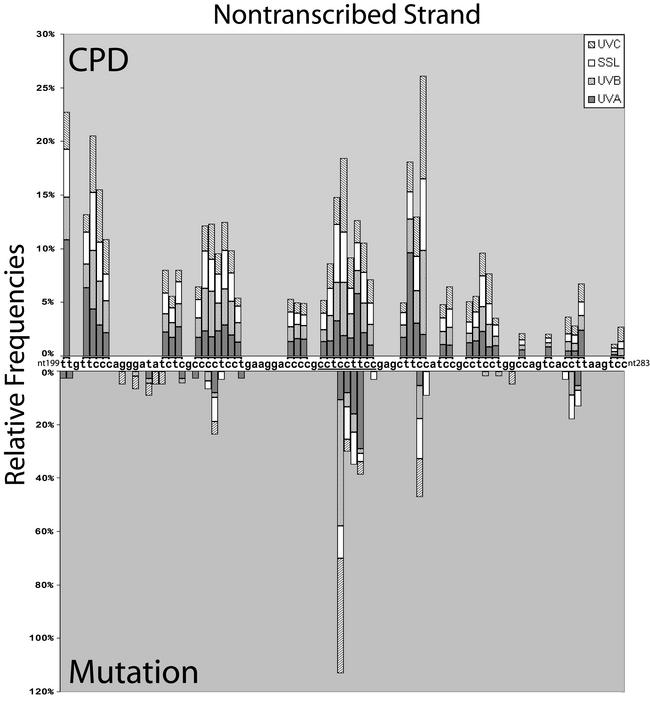
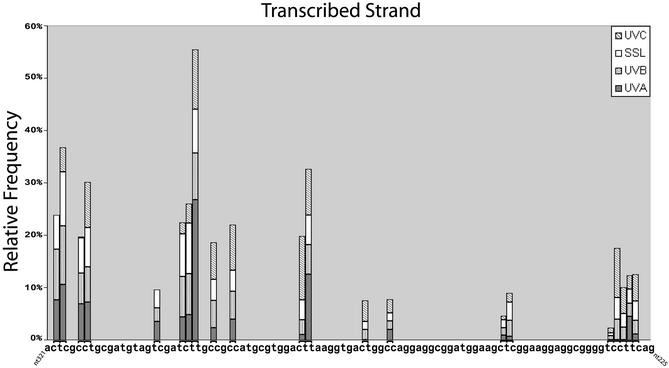
Ligation-mediated PCR was employed to quantify cyclobutane pyrimidine dimer (CPD) formation at nucleotide resolution along exon 2 of the adenine phosphoribosyltransferase (aprt) locus in Chinese hamster ovary (CHO) cells following irradiation with either UVA (340-400 nm), UVB (295-320 nm), UVC (254 nm) or simulated sunlight (SSL; lambda > 295 nm). The resulting DNA damage spectrum for each wavelength region was then aligned with the corresponding mutational spectrum generated previously in the same genetic target. The DNA sequence specificities of CPD formation induced by UVC, UVB or SSL were very similar, i.e., in each case the overall relative proportion of this photoproduct forming at TT, TC, CT and CC sites was approximately 28, approximately 26, approximately 16 and approximately 30%, respectively. Furthermore, a clear correspondence was noted between the precise locations of CPD damage hotspots, and of 'UV signature' mutational hotspots consisting primarily of C-->T and CC-->TT transitions within pyrimidine runs. However, following UVA exposure, in strong contrast to the above situation for UVC, UVB or SSL, CPDs were generated much more frequently at TT sites than at TC, CT or CC sites (57% versus 18, 11 and 14%, respectively). This CPD deposition pattern correlates well with the strikingly high proportion of mutations recovered opposite TT dipyrimidines in UVA- irradiated CHO cells. Our results directly implicate the CPD as a major promutagenic DNA photoproduct induced specifically by UVA in rodent cells.
Figures

Similar articles
-
Mechanistic considerations on the wavelength-dependent variations of UVR genotoxicity and mutagenesis in skin: the discrimination of UVA-signature from UV-signature mutation.Photochem Photobiol Sci. 2018 Dec 5;17(12):1861-1871. doi: 10.1039/c7pp00360a. Photochem Photobiol Sci. 2018. PMID: 29850669 Review.
-
Cyclobutane pyrimidine dimers do not fully explain the mutagenicity induced by UVA in Chinese hamster cells.Mutat Res. 2008 Dec 15;648(1-2):32-9. doi: 10.1016/j.mrfmmm.2008.09.011. Epub 2008 Oct 4. Mutat Res. 2008. PMID: 18950648
-
The mutational specificity of simulated sunlight at the aprt locus in rodent cells.Carcinogenesis. 1994 Aug;15(8):1577-83. doi: 10.1093/carcin/15.8.1577. Carcinogenesis. 1994. PMID: 8055636
-
Site-specific analysis of UV-induced cyclobutane pyrimidine dimers in nucleotide excision repair-proficient and -deficient hamster cells: Lack of correlation with mutational spectra.Mutat Res. 2009 Apr 26;663(1-2):7-14. doi: 10.1016/j.mrfmmm.2008.12.007. Epub 2008 Dec 27. Mutat Res. 2009. PMID: 19150617
-
Mutations induced by ultraviolet light.Mutat Res. 2005 Apr 1;571(1-2):19-31. doi: 10.1016/j.mrfmmm.2004.06.057. Epub 2005 Jan 20. Mutat Res. 2005. PMID: 15748635 Review.
Cited by
-
Topology and Excited State Multiplicity as Controlling Factors in the Carbazole-Photosensitized CPD Formation and Repair.J Org Chem. 2022 Sep 2;87(17):11433-11442. doi: 10.1021/acs.joc.2c00942. Epub 2022 Aug 18. J Org Chem. 2022. PMID: 35980822 Free PMC article.
-
Autophagy in UV Damage Response.Photochem Photobiol. 2017 Jul;93(4):943-955. doi: 10.1111/php.12691. Epub 2017 Jan 27. Photochem Photobiol. 2017. PMID: 27935061 Free PMC article. Review.
-
UVA-light-induced mutagenesis in the exome of human nucleotide excision repair-deficient cells.Photochem Photobiol Sci. 2025 Mar;24(3):429-449. doi: 10.1007/s43630-025-00697-9. Epub 2025 Mar 10. Photochem Photobiol Sci. 2025. PMID: 40063310
-
The relevance of the vitamin D endocrine system (VDES) for tumorigenesis, prevention, and treatment of non-melanoma skin cancer (NMSC): Present concepts and future perspectives.Dermatoendocrinol. 2013 Jan 1;5(1):38-50. doi: 10.4161/derm.24156. Dermatoendocrinol. 2013. PMID: 24494041 Free PMC article. Review.
-
Genomic sites hypersensitive to ultraviolet radiation.Proc Natl Acad Sci U S A. 2019 Nov 26;116(48):24196-24205. doi: 10.1073/pnas.1907860116. Epub 2019 Nov 13. Proc Natl Acad Sci U S A. 2019. PMID: 31723047 Free PMC article.
References
-
- Black H.S., deGruijl,F.R., Forbes,P.D., Cleaver,J.E., Ananthaswamy,H.N., deFabo,E.C., Ullrich,S.E. and Tyrrell,R.M. (1997) Photocarcinogenesis: an overview. J. Photochem. Photobiol. B., 40, 29–47. - PubMed
-
- Ananthaswamy H.N., Fourtanier,A., Evans,R.L., Tison,S., Medaisko,C., Ullrich,S.E. and Kripke,M.L. (1998) p53 Mutations in hairless SKH-hr1 mouse skin tumors induced by a solar simulator. Photochem. Photobiol., 67, 227–232. - PubMed
-
- Mullenders L.H., Hazekamp-van Dokkum,A.M., Kalle,W.H., Vrieling,H., Zdzienicka,M.Z. and van Zeeland,A.A. (1993) UV-induced photolesions, their repair and mutations. Mutat. Res., 299, 271–276. - PubMed
