. 2003 Jun 1;31(11):2811-23.
doi: 10.1093/nar/gkg386.

Using structural motif templates to identify proteins with DNA binding function

Affiliations

Using structural motif templates to identify proteins with DNA binding function

Susan Jones et al. Nucleic Acids Res. .

Abstract

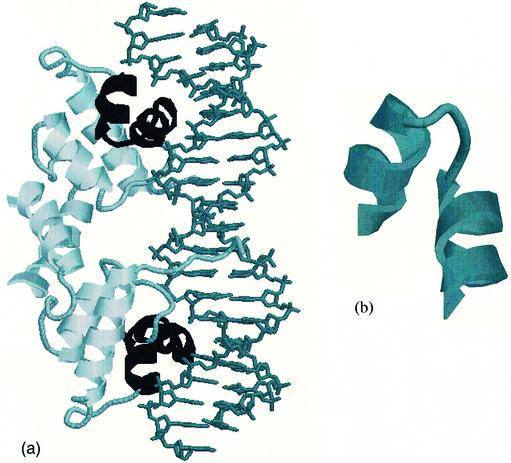
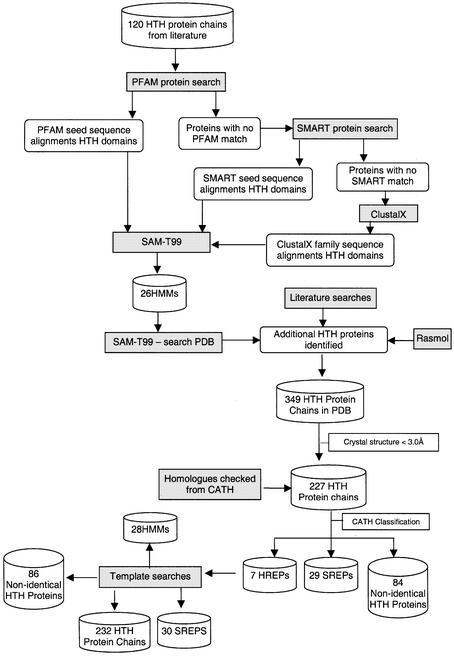
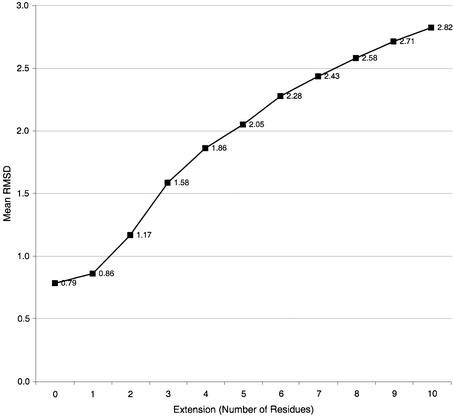
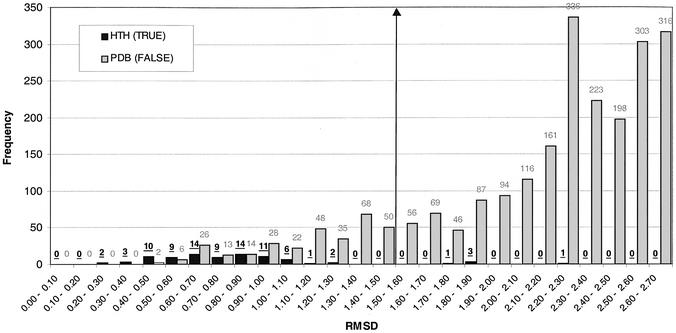
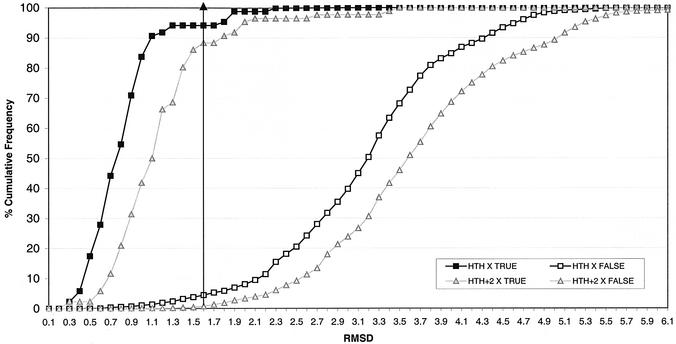
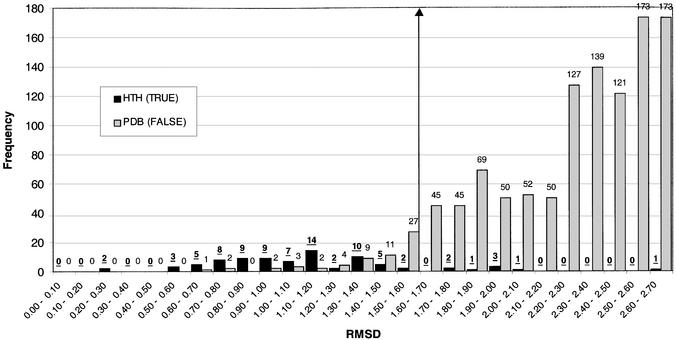
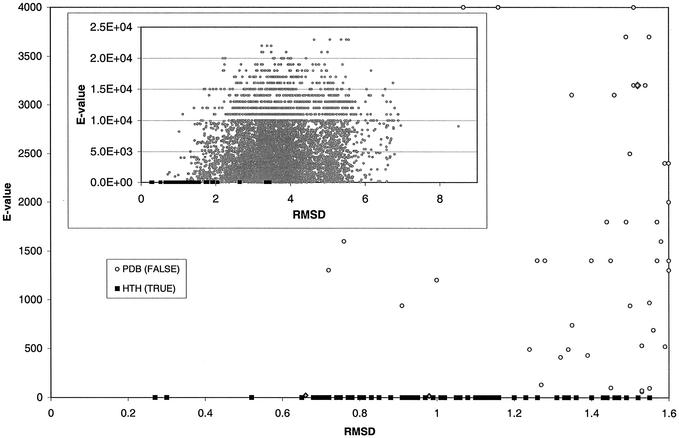
This work describes a method for predicting DNA binding function from structure using 3-dimensional templates. Proteins that bind DNA using small contiguous helix-turn-helix (HTH) motifs comprise a significant number of all DNA-binding proteins. A structural template library of seven HTH motifs has been created from non-homologous DNA-binding proteins in the Protein Data Bank. The templates were used to scan complete protein structures using an algorithm that calculated the root mean squared deviation (rmsd) for the optimal superposition of each template on each structure, based on C(alpha) backbone coordinates. Distributions of rmsd values for known HTH-containing proteins (true hits) and non-HTH proteins (false hits) were calculated. A threshold value of 1.6 A rmsd was selected that gave a true hit rate of 88.4% and a false positive rate of 0.7%. The false positive rate was further reduced to 0.5% by introducing an accessible surface area threshold value of 990 A2 per HTH motif. The template library and the validated thresholds were used to make predictions for target proteins from a structural genomics project.


Figures

Figure 1
Figure 1
(a) Rasmol image of the dimeric λ repressor/operator complex [PDB code 1lmb (3)] with the HTH motif in each protein subunit highlighted in black. The protein is depicted with the secondary structures as cartoons and the double-stranded DNA molecule is shown in stick representation. (b) Detail of Rasmol image of the HTH motif extracted from chain 3 of the λ repressor/operator complex which spans residues 33–51.
Figure 2
Figure 2
Flow diagram summarising the process of creating a comprehensive reference data set of 3D protein structures containing HTH motifs. The starting point was a list of 120 proteins known to contain HTH motifs as collated from the literature. The end point was 86 non-identical HTH structural motifs associated with HMMs of 28 sequence families. SREPs are representative proteins from sequence families clustered at the 35% identity level. HREPs are representative proteins from homologous fold families (clustered at the H-level in CATH).
Figure 3
Figure 3
Mean minimum rmsd values obtained from the scanning of extended templates from the 29 sequence representatives (Table 2) against the same 29 structures (rmsd values for self-matches were not included). The values on the x-axis are the numbers of residues added to the start and end of the HTH motifs.
Figure 4
Figure 4
Frequency histogram showing the distribution of rmsd values resulting from a scan of seven HTH templates against 84 HTH proteins (HTH X HTH) and 8266 PDB proteins (excluding known HTH proteins) (HTH X FALSE). The HTH X HTH distribution is shown in black and the HTH X FALSE distribution is shown in grey. The maximum rmsd shown is 2.7 Å. A threshold value is indicated at 1.6 Å, below which a protein is predicted to contain a DNA-binding HTH motif.
Figure 5
Figure 5
Cumulative frequency histogram showing the distribution of rmsd values resulting from a scan of seven HTH templates against 84 non-identical HTH proteins (HTH X TRUE) and 8266 PDB proteins (excluding known HTH proteins) (HTH X FALSE), using the original templates (not extended) and using +2 residue extended templates. The points of the distributions for the original templates are shown with squares and for the extended templates as triangles. The maximum rmsd shown is 6.1 Å.
Figure 6
Figure 6
Frequency histogram showing the distribution of rmsd values resulting from a scan of seven HTH templates against 86 HTH proteins (HTH X HTH) and 8264 PDB proteins (excluding known HTH proteins) (HTH X FALSE). The HTH X HTH distribution is shown in black and the HTH X FALSE distribution is shown in grey. The maximum rmsd shown is 2.7 Å. A threshold value is indicated at 1.6 Å, below which a protein is predicted to contain a DNA-binding HTH motif.
Figure 7
Figure 7
Scatter plot of E values derived from HMM scans of protein sequence against rmsd values from 3D extended motif scans of protein structure. The inset graph shows the distribution of rmsd values up to a maximum of 8.5 Å and E values to a maximum of 2.5E + 04 with values rounded to two significant figures as recorded in the results from SAM-T99. The main graphs show the distribution with rmsd values to a maximum of 1.6 Å and E values to a maximum of 4000. The data points for the 86 known HTH motifs (TRUE) are shown in filled black squares, those for the remaining PDB structures not known to contain DNA binding HTH motifs (FALSE) are shown as open grey circles. The filled grey diamonds indicate the two structures (1fy7A and 1mgtA) both predicted to include DNA-binding HTH motifs. These data are derived from the third scan of the PDB with seven non-homologous extended HTH motifs.
Figure 8
Figure 8
(Previous page) Wheel diagrams depicting the identification of HTH motifs within a set of 30 sequence representatives. The PDB codes of the 30 proteins (identified in Table 2) are shown clustered into homologous families and the PDB codes in each family are shown in a different colour. The HREP from each family is indicated by a [H] printed next to each PDB code. Within each family the members are clustered according to CATH number (to the S-level) except where SREP proteins belong to the same Pfam family and are represented by the same HMM. In such cases the PDB codes sharing the same HMM are shown clustered together. (a) HTH identification using full sequence HMMs. A line joining two PDB codes indicates the successful match of one protein’s HMM against the sequence of the second protein. A successful match was taken as a HMM matching a representative sequence with an E value of <0.01. (b) HTH identification using structural templates. A line joining two PDB codes indicates the successful match of one structure’s template against the structure of the second protein. A successful match was taken as one where a maximal superposition gave a rmsd <1.6 Å.

References

    1. Berman H.M., Westbrook,J., Feng,Z., Gilliland,G., Bhat,T.N., Weissig,H., Shindyalov,I.N. and Bourne,P.E. (2000) The Protein Data Bank. Nucleic Acids Res., 28, 276–280. - PMC - PubMed
    1. Brennan R.G. and Matthews,B.W. (1989) The helix-turn-helix DNA-binding motif. J. Biol. Chem., 264, 1903–1906. - PubMed
    1. Beamer L.J. (1992) Refined 1.8 angstrom crystal-structure of the lambda-repressor operator complex. J. Mol. Biol., 227, 20. - PubMed
    1. Luscombe N.M. and Thornton,J.M. (2002) Protein-DNA interactions: amino acid conservation and the effects of mutations on binding specificity. J. Mol. Biol., 320, 991–1009. - PubMed
    1. Orengo C.A., Michie,A.D., Jones,S., Jones,D.T., Swindells,M.B. and Thornton,J.M. (1997) CATH – a hierarchic classification of protein domain structures. Structure, 5, 1093–1108. - PubMed

Publication types

Substances

Associated data