

PopMod: a longitudinal population model with two interacting disease states
- PMID: 12773215
- PMCID: PMC156025
- DOI: 10.1186/1478-7547-1-6
PopMod: a longitudinal population model with two interacting disease states
Abstract
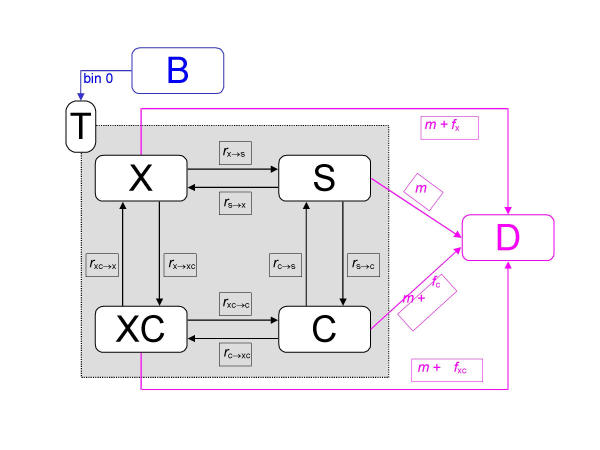
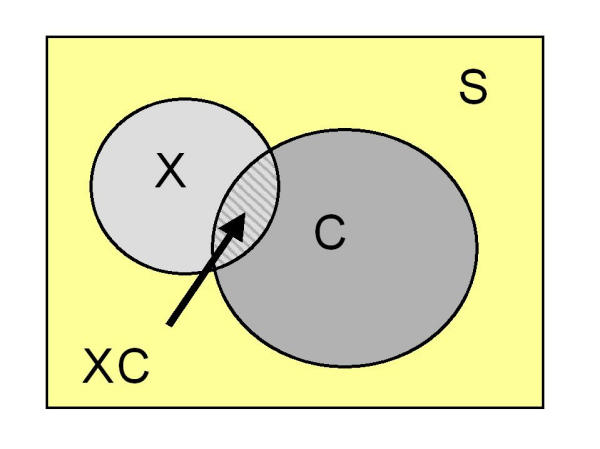
This article provides a description of the population model PopMod, which is designed to simulate the health and mortality experience of an arbitrary population subjected to two interacting disease conditions as well as all other "background" causes of death and disability. Among population models with a longitudinal dimension, PopMod is unique in modelling two interacting disease conditions; among the life-table family of population models, PopMod is unique in not assuming statistical independence of the diseases of interest, as well as in modelling age and time independently. Like other multi-state models, however, PopMod takes account of "competing risk" among diseases and causes of death.PopMod represents a new level of complexity among both generic population models and the family of multi-state life tables. While one of its intended uses is to describe the time evolution of population health for standard demographic purposes (e.g. estimates of healthy life expectancy), another prominent aim is to provide a standard measure of effectiveness for intervention and cost-effectiveness analysis. PopMod, and a set of related standard approaches to disease modelling and cost-effectiveness analysis, will facilitate disease modelling and cost-effectiveness analysis in diverse settings and help make results more comparable.
Figures
References
-
- Shryock HS, Siegel JS. The life table. In: Stockwell EG, editor. The methods and materials of demography. Orlando, FL, Academic Press; 1976. p. 250.
-
- Hacking I. The emergence of probability. Cambridge, Cambridge University Press. 1975.
-
- Barendregt JJ, Bonneux L. Degenerative disease in an aging population: models and conjectures. Enschede, Netherlands, Febodruke. 1998.
-
- Manton KG, Stallard E. Chronic disease modelling. London, Charles Griffin. 1988.
-
- Schoen R. Modelling multigroup populations. New York and London, Plenum Press. 1987.
LinkOut - more resources
Full Text Sources
