. 2003 Jun;23(12):4046-55.
doi: 10.1128/MCB.23.12.4046-4055.2003.

Cotranscriptional processing of Drosophila histone mRNAs

Affiliations

Cotranscriptional processing of Drosophila histone mRNAs

Todd E Adamson et al. Mol Cell Biol. 2003 Jun.

Abstract

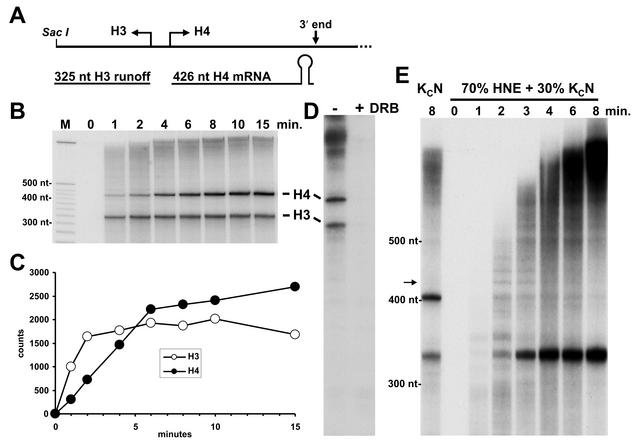
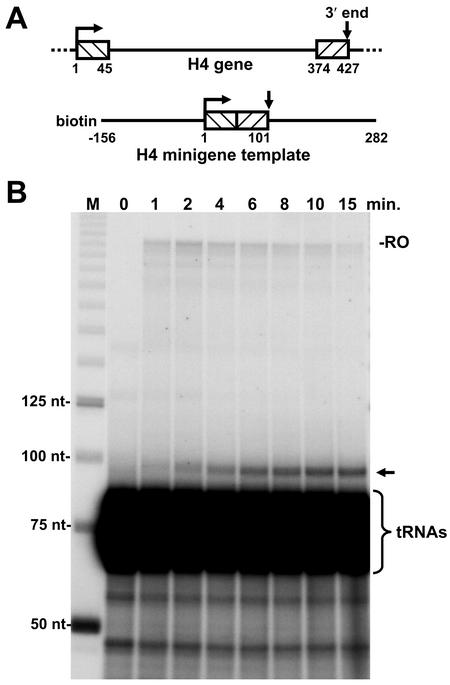
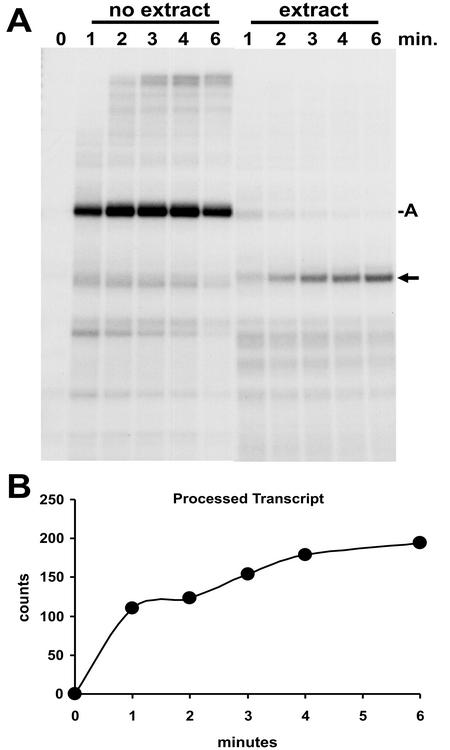
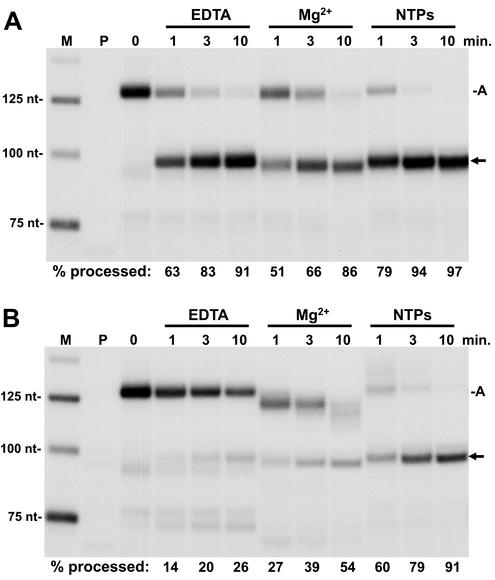
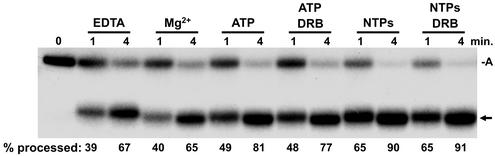
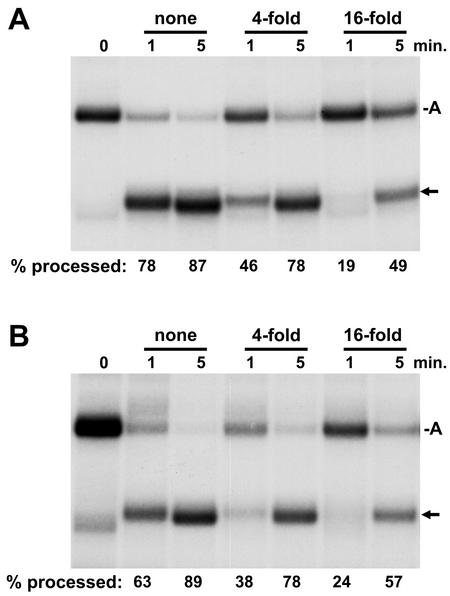
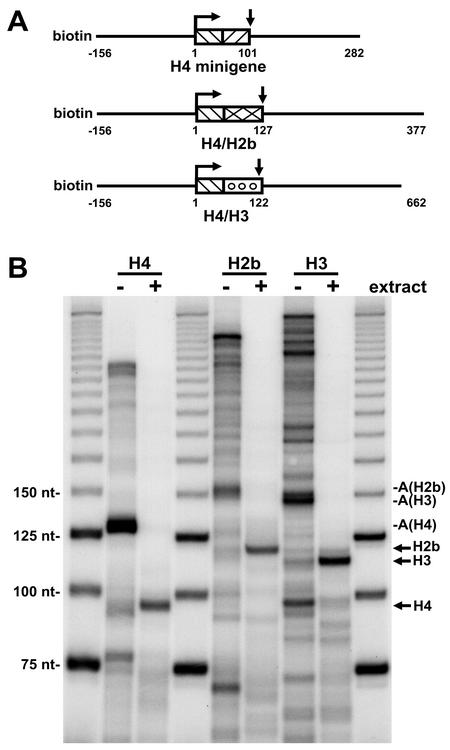
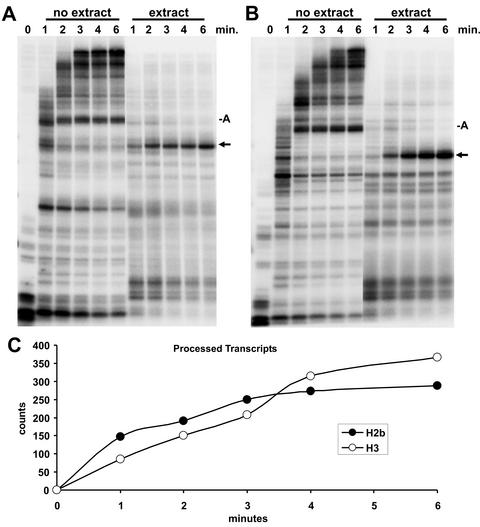
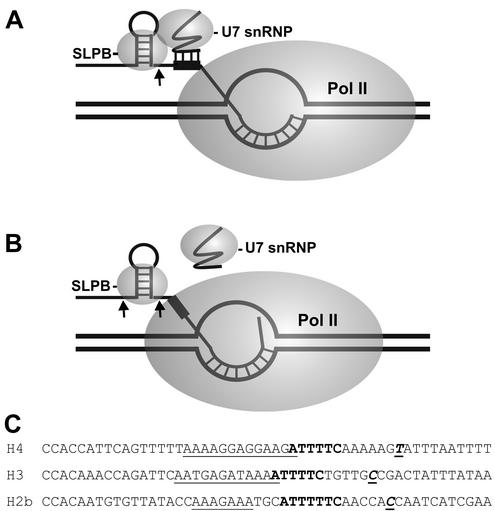
The 3' ends of metazoan histone mRNAs are generated by specialized processing machinery that cleaves downstream of a conserved stem-loop structure. To examine how this reaction might be influenced by transcription, we used a Drosophila melanogaster in vitro system that supports both processes. In this system the complete synthesis of histone mRNA, including transcription initiation and elongation, followed by 3' end formation, occurred at a physiologically significant rate. Processing of free transcripts was efficient and occurred with a t(1/2) of less than 1 min. Divalent cations were not required, but nucleoside triphosphates (NTPs) stimulated the rate of cleavage slightly. Isolated elongation complexes encountered a strong arrest site downstream of the mature histone H4 3' end. In the presence of NTPs, transcripts in these arrested complexes were processed at a rate similar to that of free RNA. Removal of NTPs dramatically reduced this rate, potentially due to concealment of the U7 snRNP binding element. The arrest site was found to be a conserved feature located 32 to 35 nucleotides downstream of the processing site on the H4, H2b, and H3 genes. The significance of the newly discovered arrest sites to our understanding of the coupling between transcription and RNA processing on the one hand and histone gene expression on the other is discussed.


Figures

FIG. 1.
FIG. 1.
Drosophila histone RNAs are transcribed and rapidly processed in nuclear extracts from Drosophila cells. (A) Transcribed region of the Dm3000 plasmid showing H3 runoff transcript and H4 processed mRNA. (B) Pulse-chase assay using Dm3000 template and Kc cell nuclear extract. RNA was isolated at the indicated times and analyzed on a 6% denaturing gel followed by autoradiography. M, DNA markers of indicated sizes. H3 runoff and H4 mRNA are indicated. (C) Quantitation of H3 and H4 transcripts. Transcripts in the dried gel were quantitated by using a Packard InstantImager and the relative counts plotted. (D) Continuous-labeling assay. The Dm3000 template was transcribed in Kc cell nuclear extract in the absence or presence of 50 μM DRB, and the resulting transcripts were analyzed on a 6% denaturing gel. (E) Inhibition of RNA processing in a mixture of HeLa and Kc cell nuclear extracts. Reactions similar to those shown in panel B were carried out except that 70% HeLa and 30% Kc cell nuclear extract were used. Samples were collected at the indicated time points. For comparison purposes, one reaction was carried out for 8 min in the presence of only Kc cell nuclear extract. The transcripts were analyzed in a 6% denaturing gel as described above except that the gel was run longer to better separate long transcripts.
FIG. 2.
FIG. 2.
Construction and transcription of an H4 minigene. (A) Diagram of H4 gene and derived minigene template. The minigene template generated by PCR contained a biotin molecule on the upstream end and was missing 328 nt from the coding region of the H4 gene. (B) Pulse-chase assay with H3 minigene template and Kc cell nuclear extract. RNA was isolated at the indicated times and analyzed on a 6.7% denaturing gel, followed by autoradiography. M, DNA markers of indicated sizes. Runoff (RO), end-labeled tRNAs, and processed transcript (arrow) are indicated.
FIG. 3.
FIG. 3.
Kinetic analysis of transcription and processing from the H4 minigene template. (A) Transcription from isolated early elongation complexes. Early elongation complexes were generated and isolated as described in Materials and Methods and then allowed to elongate with or without Kc cell nuclear extract as indicated. RNA was isolated at the indicated times and analyzed on a 6.7% denaturing gel, followed by autoradiography. A, arrested transcript; arrow, processed H4 minigene RNA. (B) Quantitation of processed transcript. The processed transcript was quantified by using a Packard InstantImager, and the relative counts were plotted.
FIG. 4.
FIG. 4.
Comparison of processing of free RNA to RNA in a transcription complex. Early elongation complexes generated during initiation with a pulse-labeling on the H4 minigene template (lane marked P) were isolated and washed with a high salt concentration and Sarkosyl as described in Materials and Methods. These complexes were chased for 8 min, reisolated, and phenol extracted to obtain free RNA or used directly as elongation complexes. (A) Processing of free RNA. Free RNA containing predominantly the arrested transcript was subjected to processing by nuclear extract for the indicated times with EDTA, Mg, or NTPs with Mg added. (B) Processing of RNA in elongation complexes. Reactions were identical to those in panel A except that the RNA was in a transcription complex. For both panels A and B, RNA was isolated at the indicated times and analyzed on a 6.7% denaturing gel, followed by autoradiography and quantitation with a Packard InstantImager. The percentage of total RNA processed is given under each lane. A, arrested transcript; arrow, processed H4 minigene RNA.
FIG. 5.
FIG. 5.
Effect of nucleotides on processing of free RNA. Transcripts were isolated from elongation complexes as in Fig. 4A and processed with nuclear extract under the indicated conditions. RNA was isolated at the indicated times and analyzed on a 6.7% denaturing gel, followed by autoradiography. A, arrested transcript; arrow, processed H4 minigene RNA. The percentage of total RNA processed is given under each lane.
FIG. 6.
FIG. 6.
Dependence of processing on extract concentration. Free RNA (A) or isolated elongation complexes (B) were processed by using nuclear extract for the indicated times. A constant amount of extract was used for each reaction, but the concentration was changed by dilution as indicated. RNA was isolated at the indicated times and analyzed on a 6.7% denaturing gel, followed by autoradiography. A, arrested transcript; arrow, processed transcript. The percentage of total RNA processed is given under each lane.
FIG. 7.
FIG. 7.
Comparison of H4, H2b, and H3 genes. (A) Minigene constructs. The 3′ ends of the H2b and H3 genes were cloned downstream of the H4 promoter to give processed transcripts of the indicated sizes. Templates were generated by PCR by using a biotinylated upstream primer and a downstream primer that resulted in a runoff transcript of the indicated size. (B) Transcription and processing of the minigenes. Early elongation complexes were formed during a pulse-labeling step with each of the three minigene templates. The early elongation complexes were washed with a high salt concentration and Sarkosyl and chased in the absence (−) or presence (+) of extract for 10 min. A, arrested transcript; arrow, processed transcript.
FIG. 8.
FIG. 8.
Kinetics of transcription and processing on the H4/H2b and H4/H3 minigenes. Transcription and processing as described in Fig. 7 was carried out on the H4/H2b (A) and the H4/H3 (B) minigenes. RNA was isolated at the indicated time points and analyzed on a 6.7% denaturing gel, followed by autoradiography. (C) The processed transcripts were quantitated by using a Packard InstantImager and plotted versus time. A, arrested transcript; arrow, processed transcript.
FIG. 9.
FIG. 9.
Negative coupling of processing to transcription. The model explains how processing might be inhibited by RNA polymerase II arrested downstream of the processing site. (A) RNA polymerase II paused at the arrest site leaves just enough RNA exposed to allow binding of SLBP and the U7 snRNP and processing of the transcript. (B) When the polymerase backslides and enters the arrested conformation, the HDE (black box) is no longer accessible to the U7 snRNP, and processing is inhibited. (C) Comparison of the 3′ regions of H4, H3, and H2b. Starting with the last two nucleotides of the stem-loop RNA, sequences from H4, H3, and H2b were aligned. Underlined text, purine-rich region; boldface text, T-rich region; boldface underlined text, pause-arrest site.

References

    1. Bentley, D. 2002. The mRNA assembly line: transcription and processing machines in the same factory. Curr. Opin. Cell Biol. 14:336-342. - PubMed
    1. Cho, D. C., E. C. Scharl, and J. A. Steitz. 1995. Decreasing the distance between the two conserved sequence elements of histone pre-messenger RNA interferes with 3′ processing in vitro. RNA 1:905-914. - PMC - PubMed
    1. Chodchoy, N., N. B. Pandey, and W. F. Marzluff. 1991. An intact histone 3′-processing site is required for transcription termination in a mouse histone H2a gene. Mol. Cell. Biol. 11:497-509. - PMC - PubMed
    1. Cramer, P., A. Srebrow, S. Kadener, S. Werbajh, M. de la Mata, G. Melen, G. Nogues, and A. R. Kornblihtt. 2001. Coordination between transcription and pre-mRNA processing. FEBS Lett. 498:179-182. - PubMed
    1. Dominski, Z., and W. F. Marzluff. 1999. Formation of the 3′ end of histone mRNA. Gene 239:1-14. - PubMed

Publication types

LinkOut - more resources