. 2003 Jun;23(12):4150-61.
doi: 10.1128/MCB.23.12.4150-4161.2003.

Role of the promoter in maintaining transcriptionally active chromatin structure and DNA methylation patterns in vivo

Affiliations

Role of the promoter in maintaining transcriptionally active chromatin structure and DNA methylation patterns in vivo

Sung-Hae Lee Kang et al. Mol Cell Biol. 2003 Jun.

Abstract

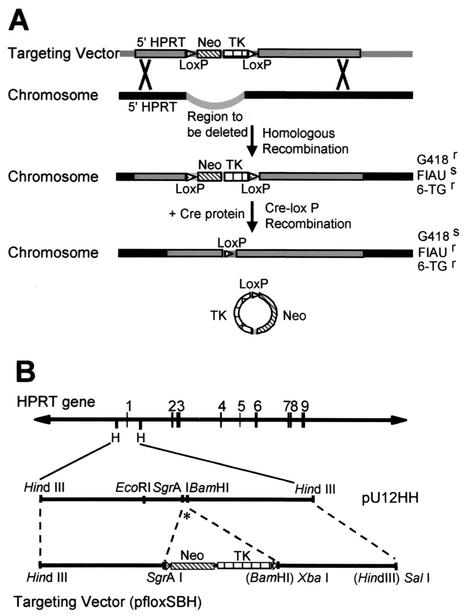
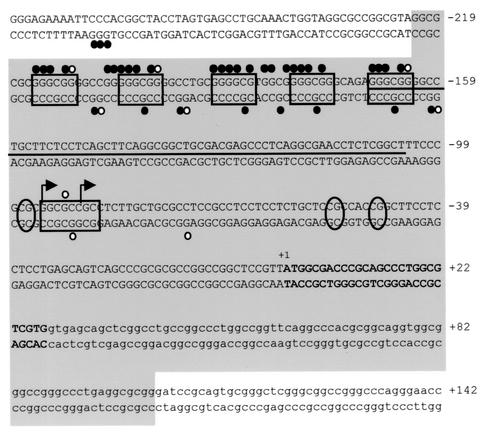
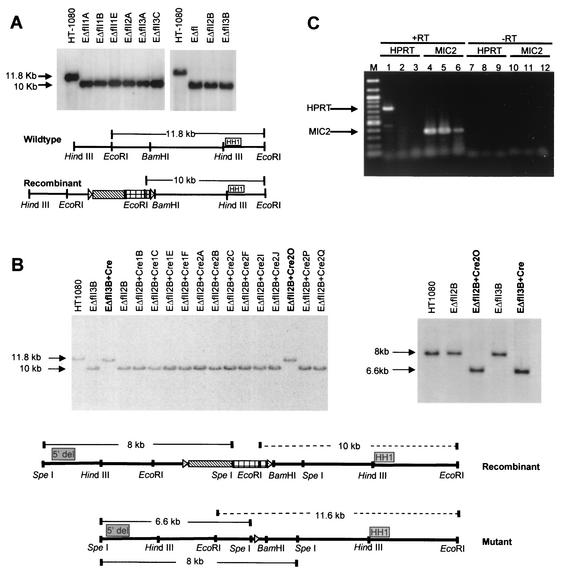
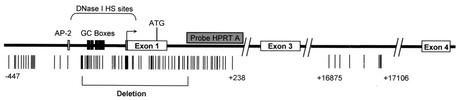
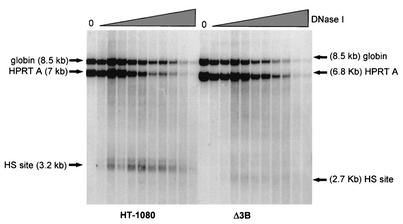
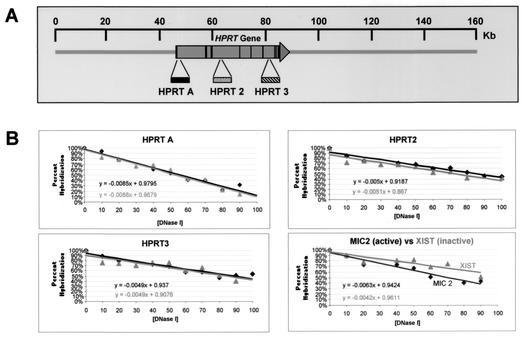
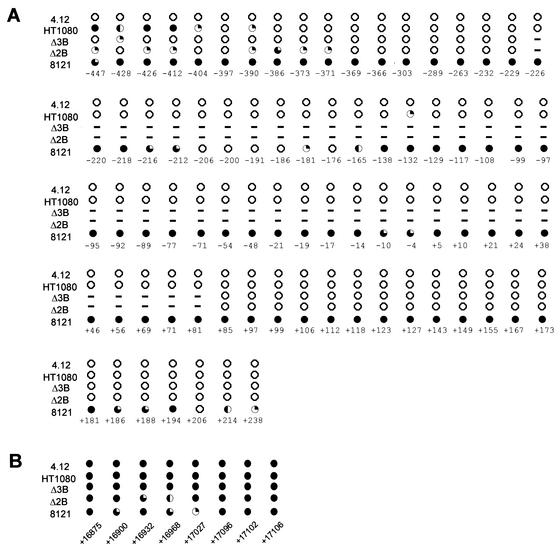
Establishment and maintenance of differential chromatin structure between transcriptionally competent and repressed genes are critical aspects of transcriptional regulation. The elements and mechanisms that mediate formation and maintenance of these chromatin states in vivo are not well understood. To examine the role of the promoter in maintaining chromatin structure and DNA methylation patterns of the transcriptionally active X-linked HPRT locus, 323 bp of the endogenous human HPRT promoter (from position -222 to +102 relative to the translation start site) was replaced by plasmid sequences by homologous recombination in cultured HT-1080 male fibrosarcoma cells. The targeted cells, which showed no detectable HPRT transcription, were then assayed for effects on DNase I hypersensitivity, general DNase I sensitivity, and DNA methylation patterns across the HPRT locus. In cells carrying the deletion, significantly diminished DNase I hypersensitivity in the 5' flanking region was observed compared to that in parental HT-1080 cells. However, general DNase I sensitivity and DNA methylation patterns were found to be very similar in the mutated cells and in the parental cells. These findings suggest that the promoter and active transcription play a relatively limited role in maintaining transcriptionally potentiated epigenetic states.


Figures

FIG. 1.
FIG. 1.
Cre-loxP gene-targeting strategy. (A) A schematic representation of the Cre-loxP recombination strategy. Gray boxes indicate targeting vector sequences. Black boxes indicate endogenous chromosomal sequences. Thick black lines indicate plasmid backbone sequences. (B) A schematic representation of construction of the targeting vector. The asterisk indicates exon 1. See text for details.
FIG. 2.
FIG. 2.
DNA sequence of the human HPRT promoter region. Boxes indicate positions of transcription factor binding sites. Circles indicate positions of dimethyl sulfate (DMS) in vivo footprints, closed circles represent DMS protections, and open circles represent sites of enhanced DMS reactivity. The thin horizontal line indicates the region of multiple transcription initiation sites, with bent arrows indicating the major sites of transcription initiation. Ovals indicate positions of methylated CpGs critical for transcriptional repression. +1 indicates the translation initiation site, with exon 1 shown in boldface. The large gray box indicates the region deleted by homologous recombination.
FIG. 3.
FIG. 3.
Identification of HPRT promoter deletion cell lines. (A) Southern blot verification of homologous recombination. DNA from G418r/6-TGr clones was digested with EcoRI for Southern blot analysis. HH1 indicates the position of an HPRT-specific probe. (B) Southern blot analysis of DNA from FIAUr clones digested with EcoRI and probed with HH1 (left panel). Shown is Southern blot verification of HPRT promoter deletions using DNA digested with SpeI from clones EΔfII3B+Cre (Δ3B) and EΔfII2B+Cre2O (Δ2B) and hybridized with probe 5′del (right panel). The diagrams below are schematic representations of the positions of probes relative to the HPRT promoter region. Dotted lines represent possible EcoRI fragments detected by probe HH1. Solid lines represent possible SpeI fragments detected by probe 5′del. (C) RT-PCR analysis for HPRT mRNA. RT-PCR was performed on total RNA from HT-1080 (lanes 1, 4, 7, and 10), Δ3B (lanes 2, 5, 8, and 11), and Δ2B (lanes 3, 6, 9, and 12) cells. HPRT and MIC2 indicate analysis with HPRT- or MIC2-specific primers, respectively. +RT or −RT indicates that the PCR was performed from template DNA generated in the presence (+) or absence (−) of RT. M indicates the 100-bp marker lane.
FIG. 4.
FIG. 4.
Physical map of the human HPRT gene. The thick horizontal line represents the HPRT gene. Open horizontal boxes represent exons, and “ATG” indicates the translation initiation site. The bent arrow represents the major transcription initiation sites, and a putative initiator element is shaded. The gray box indicates the position of probe “HPRT A.” The bracket above the line indicates the position of the 5′ flanking DNase I-hypersensitive site. The positions of CpG-dinucleotides within the gene are shown as vertical lines below the gene map. Numbers indicate the position of CpGs relative to the translation initiation site. The horizontal bracket below the line indicates the region deleted in Δ2B and Δ3B cells.
FIG. 5.
FIG. 5.
Analysis of DNase I hypersensitivity. HT-1080 (male human fibrosarcoma) cells and Δ3B (HT-1080 cells carrying the promoter mutation) cells were treated with 0, 10, 20, 30, 40, 50, 60, 70, 80, 90, and 100 μg of DNase I/ml. Southern blot analysis was performed on DNA digested with EcoRI and was hybridized to the HPRT promoter probe HPRT A. “HS site” indicates the positions of HPRT-hypersensitive sites; “globin” indicates the hybridization band detected by the control human β-globin probe.
FIG. 6.
FIG. 6.
Analysis of DNase I general sensitivity of the HPRT locus. (A) Approximate positions of slot blot hybridization probes HPRT A, HPRT2, and HPRT3, relative to the HPRT gene (large horizontal arrow); vertical lines within the arrow indicate exons. The scale at the top is relative to the human X chromosome BAC clone bWXD187 (accession no. AC004383). (B) Quantitation of general DNase I sensitivity assayed by each hybridization probe. Each panel represents analysis of general DNase I sensitivity at a given site in the HPRT gene. Quantitation of probe hybridization to slot blots was performed by PhosphorImager analysis (Materials and Methods). Linear plots were fitted to the data points, and the equation representing each line is shown. Dark lines represent DNase I digestion of HT-1080 chromatin; gray lines represent DNase I digestion of chromatin in cell line Δ3B containing the HPRT promoter mutation. The panel in the lower right corner shows a comparison of general DNase I sensitivities of chromatin from the transcriptionally active MIC2 locus (darker line) and of chromatin from the transcriptionally silenced XIST locus (lighter line) in HT-1080 cells.
FIG. 7.
FIG. 7.
High-resolution DNA methylation analysis of CpG-dinucleotides in the human HPRT promoter and intron 3. The methylation status of individual CpG-dinucleotides on the upper strand was determined by sodium bisulfite genomic sequencing. Each CpG-dinucleotide was sequenced a minimum of seven times after chemical conversion with bisulfite. (A) Methylation pattern of a 698-bp region in the HPRT promoter region. (B) Methylation pattern of eight CpGs within intron 3 of the HPRT gene. All position numbers are relative to the translation initiation site. Closed circles indicate CpG sites that are >80% methylated, three-quarter-filled circles indicate 60 to 80% methylation, half-filled circles indicate 40 to 60% methylation, one-quarter-filled circles indicate 20 to 40% methylation, and open circles indicate <20% methylation. Dashed lines indicate CpGs deleted in Δ2B and Δ3B.

Similar articles

Cited by

References

    1. Bender, M. A., M. Bulger, J. Close, and M. Groudine. 2000. Beta-globin gene switching and DNase I sensitivity of the endogenous beta-globin locus in mice do not require the locus control region. Mol. Cell 5:387-393. - PubMed
    1. Boyes, J., and G. Felsenfeld. 1996. Tissue-specific factors additively increase the probability of the all-or-none formation of a hypersensitive site. EMBO J. 15:2496-2507. - PMC - PubMed
    1. Brandeis, M., D. Frank, I. Keshet, Z. Siegfried, M. Mendelsohn, A. Nemes, V. Temper, A. Razin, and H. Cedar. 1994. Sp1 elements protect a CpG island from de novo methylation. Nature 371:435-438. - PubMed
    1. Brown, C. J., A. Ballabio, J. L. Rupert, R. G. Lafreniere, M. Grompe, R. Tonlorenzi, and H. F. Willard. 1991. A gene from the region of the human X inactivation centre is expressed exclusively from the inactive X chromosome. Nature 349:38-44. - PubMed
    1. Brown, S. A., and R. E. Kingston. 1997. Disruption of downstream chromatin directed by a transcriptional activator. Genes Dev. 11:3116-3121. - PMC - PubMed

Publication types

MeSH terms

LinkOut - more resources