. 2003 Jun;23(12):4319-30.
doi: 10.1128/MCB.23.12.4319-4330.2003.

Molecular origins for the dominant negative function of human glucocorticoid receptor beta

Affiliations

Molecular origins for the dominant negative function of human glucocorticoid receptor beta

Matthew R Yudt et al. Mol Cell Biol. 2003 Jun.

Abstract

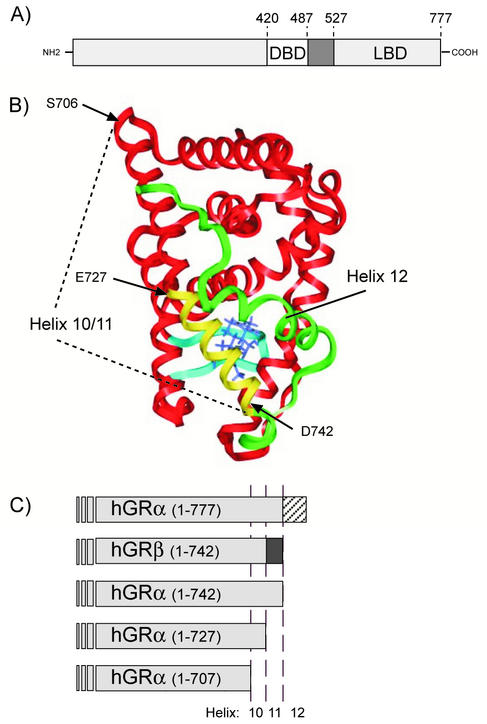
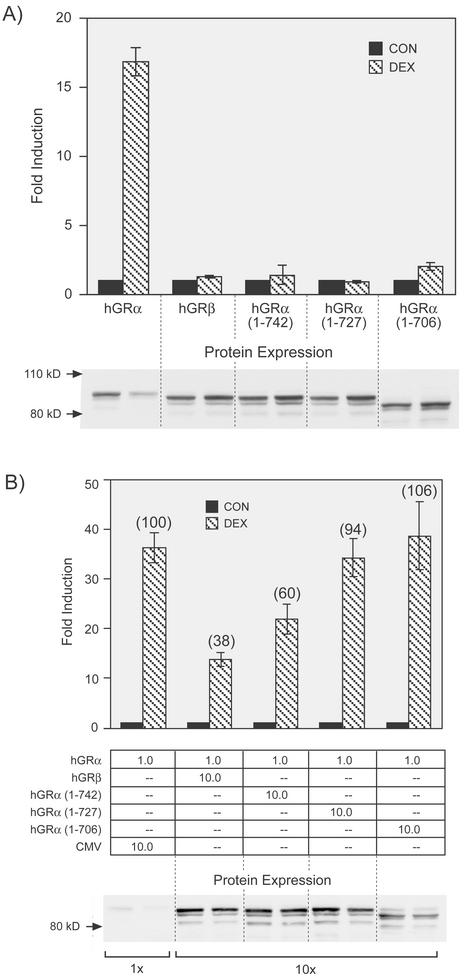
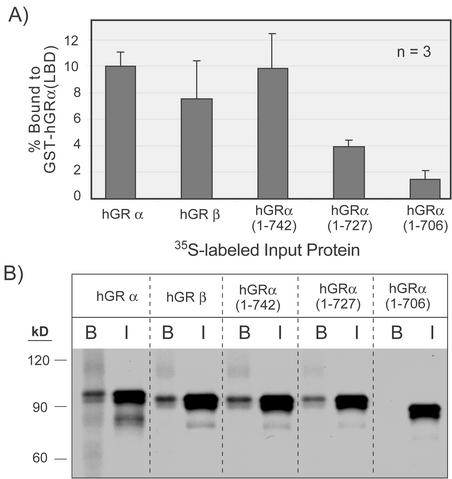
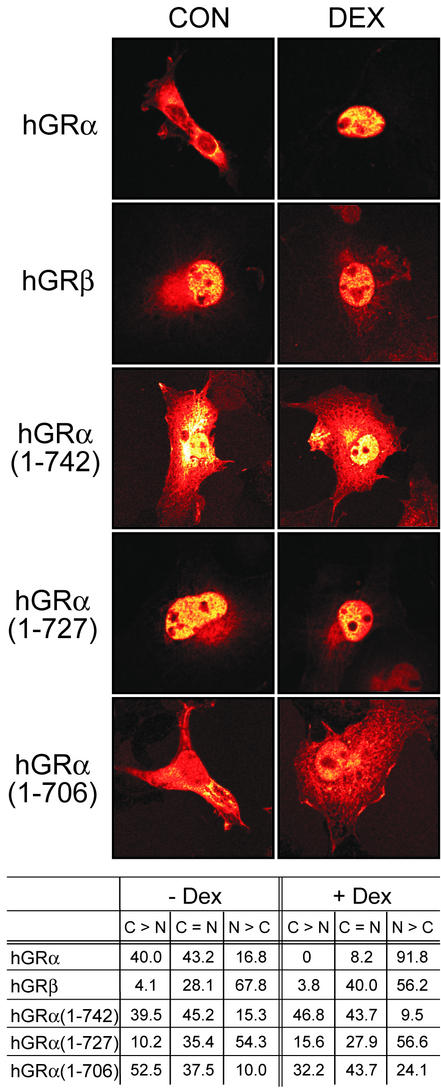
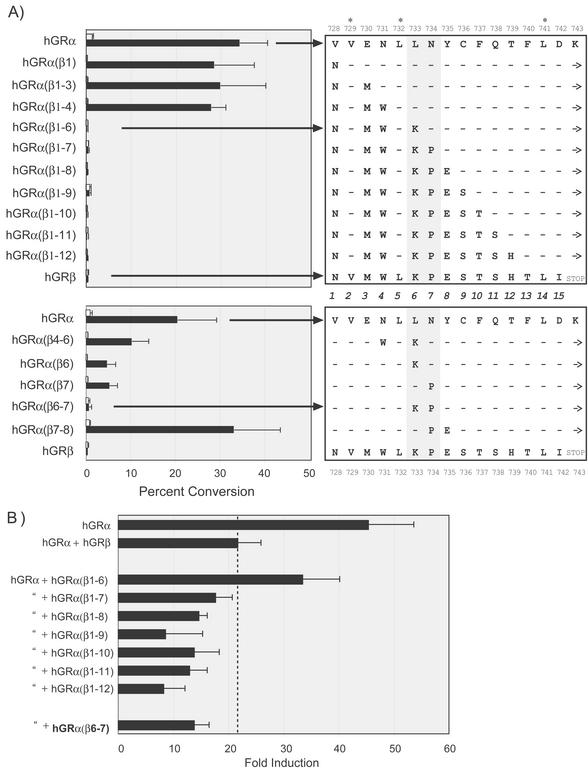
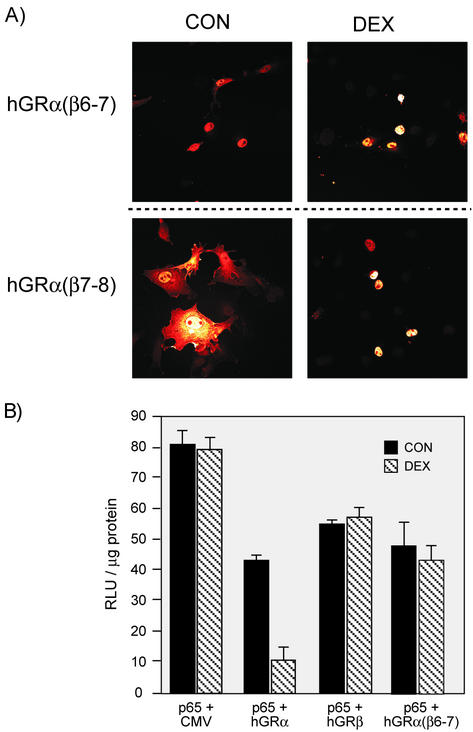
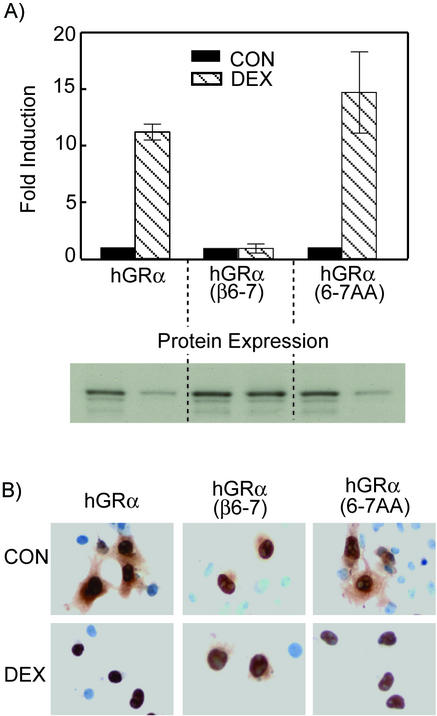
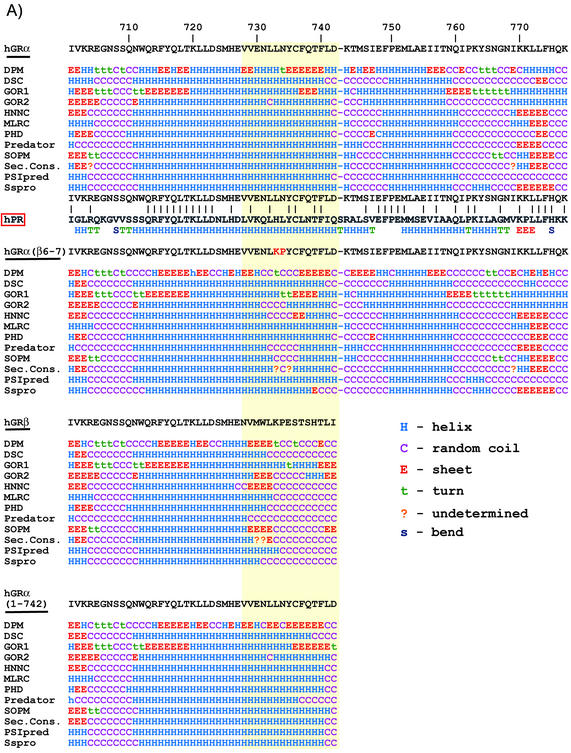
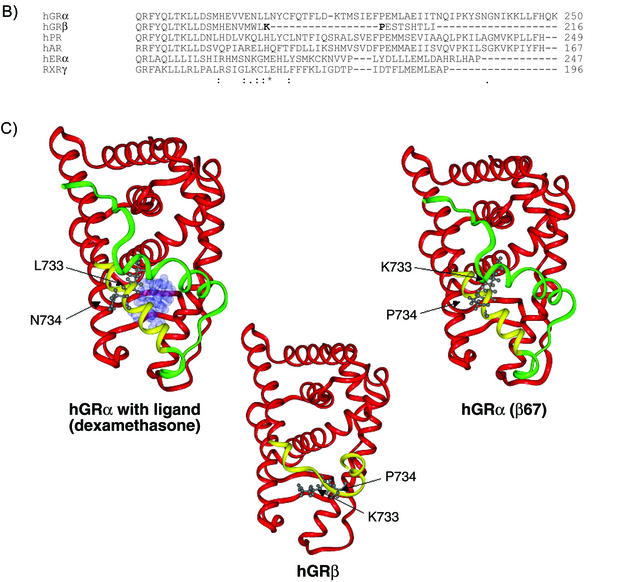
This study molecularly elucidates the basis for the dominant negative mechanism of the glucocorticoid receptor (GR) isoform hGRbeta, whose overexpression is associated with human glucocorticoid resistance. Using a series of truncated hGRalpha mutants and sequential mutagenesis to generate a series of hGRalpha/beta hybrids, we find that the absence of helix 12 is neither necessary nor sufficient for the GR dominant negative phenotype. Moreover, we have localized the dominant negative activity of hGRbeta to two residues and found that nuclear localization, in addition to heterodimerization, is a critical feature of the dominant negative activity. Molecular modeling of wild-type and mutant hGRalpha and hGRbeta provides structural insight and a potential physical explanation for the lack of hormone binding and the dominant negative actions of hGRbeta.


Figures

FIG. 1.
FIG. 1.
(A) Linear representation of the hGRα, indicating the boundaries of the DBD and LBD. (B) Homology model of the hGRα LBD (residues 525 to 777) based on the crystal structure coordinates of the progesterone receptor (PR) LBD (45). The three amino acids labeled, S706, E727, and D742, represent the boundaries of the truncation mutants described below. The residues, which are unique for hGRβ (amino acids 728 through 742), are shown in yellow, while the entire H11-H12 loop and H12 are shown in green (residues 743 to 777). (C) Illustration of hGRα C-terminal deletion constructs used in the experiments described. hGRα(1-742) represents an hGRα truncation that is the same length as hGRβ. hGRα(1-727), previously described by Oakley et al., is truncated at the hGRα and hGRβ divergence point. Finally, in the hGRα(1-706) truncation, the entirety of H10/11 and H12 is removed.
FIG. 2.
FIG. 2.
A) Transactivation of hGRα, hGRβ, and hGRα truncation mutants. The hGRα proteins described in Fig. 1C were analyzed for transactivation potential following transient transfection in GR-deficient COS-1 cells. Cells were cotransfected with the indicated GR expression vector and a glucocorticoid-responsive MMTV-CAT reporter gene (pGMCS). Hormone response was measured as the fold induction of CAT activity in response to 100 nM Dex treatment (DEX, hatched bars) over that of untreated cells (CON, solid bars). Data are an average from two experiments with the indicated standard error of the mean. Protein expression levels, determined by Western blotting for each condition, are shown beneath the graph. (B) Dominant negative activities of hGRβ and the three-hGRα truncation mutants. Dominant negative activity is measured as the decrease in hormone response (fold induction) upon coexpression of hGRα with 10-fold more of the empty vector (pCMV5 [CMV]), hGRβ, or the other hGRα truncation mutants. The percentage of transactivation is shown in parentheses above each bar, where hGRα plus the empty pCMV5 vector is 100%. The relative amounts of transfected expression vectors are indicated below the graph. Transfection and CAT assays were carried out as for panel A. Data shown are an average for four to seven experiments with the indicated standard error of the mean.
FIG. 3.
FIG. 3.
In vitro interaction of hGRα LBD with hGRα, hGRβ, and hGRα C-terminal truncation mutants. A) Summary of GST pull-down assays. The E. coli-expressed hGRα LBD (amino acids 525 to 777) was immobilized on glutathione agarose and incubated with the indicated 35S-labeled, in vitro-translated hGR proteins described in Fig. 1C. The percent of 35S-protein bound by GST-hGRα LBD averaged from three independent experiments was determined by densitometry of autoradiographs. (B) A representative autoradiograph of the data summarized in panel A. I indicates input protein, and B is the bound fraction. Positions of molecular size markers are shown to the left.
FIG. 4.
FIG. 4.
Immunocytochemical analysis of hGRs. The subcellular distribution of hGRα, hGRβ, and the indicated hGRα truncation mutants was measured in the absence (CON) and presence (DEX) of Dex. A representative image for each condition is shown. The data were quantified by ranking cell staining according to their predominantly cytosolic (C > N), predominantly nuclear (N > C), or equivalent (C = N) distribution. The numbers represent the percentages of cells counted which fell into the indicated rank. Approximately 150 cells were counted from two or three individual experiments.
FIG. 5.
FIG. 5.
Transactivation and dominant negative activity of hGRα/β hybrids. (A) The amino acids 728 to 742 of hGRα were replaced with the corresponding amino acids of hGRβ in a sequential fashion. The residues from 728 through 742 were numbered 1 to 15, shown in the center. Note that three residues, Val729 (position 2), Leu732 (position 5), and Leu741 (position 14), are conserved in both hGRα and hGRβ (∗). Beginning with the mutation of Val728 to Asp, hGRα(β1), each additional mutant included the one before it, until a complete hGRα/β hybrid was generated. − indicates that no change from wt hGRα was made. Only the first 12 sequential mutants are shown. Dex-induced transactivation was measured as for Fig. 2A with the data expressed as percent conversion of [14C]chloramphenicol to the acetylated form. The top panel shows the sequential mutants, where each residue in hGRα was changed with a corresponding hGRβ residue in succession. The bottom panel shows data from single and double point mutants described in the text. For each data set the wt hGRα is shown as the top sequence and the hGRβ sequence is on the bottom. Note that each hybrid contains the H12 carboxy-terminal extension (→), except hGRβ, which terminates following Ile742. The shaded region through positions 6 and 7 (amino acids 733 and 734) indicates the two amino acid mutations sufficient to completely block transactivation. As in Fig. 2, Western blots indicated similar expression levels for each receptor tested (data not shown). (B) The hybrid receptors from panel A that were completely deficient in Dex-induced transactivation were tested for dominant negative activity following the experimental protocol described for Fig. 2A. The top two bars, hGRα (+ pCMV5) and hGRα + hGRβ, are the controls. The dashed line indicates the level of dominant negative activity observed with hGRβ. All receptors tested for dominant negative activity were transfected at 10-fold-higher levels relative to levels for hGRα. The middle bars are the sequential mutants that lack transactivation, and the double mutant, hGRα(β6-7), is shown at the bottom.
FIG. 6.
FIG. 6.
Analysis of hGRα(β6-7). (A) Nuclear localization of double mutants hGRα(β6-7) and hGRα(β7-8). The dominant negative double mutant hGRα(β6-7) was compared with the double mutant hGRα(β7-8), which appears normal in transactivation (see Fig. 5). Immunocytochemistry was carried out as for Fig. 4. (B) Repression of p65 by hGRα but not hGRβ or hGRα(β6-7). COS1 cells were transfected with the 3X MHC-luc reporter plus pCMV5, hGRα, hGRβ, or hGRα(β6-7) and treated with 100 nM Dex or left untreated. Overexpression of hGRβ or hGRα(β6-7) does not repress transactivation of an NF-κB reporter gene in the presence of hormone.
FIG. 7.
FIG. 7.
Transactivation and nuclear localization of an hGRα alanine mutant. The amino acids at positions 6 and 7 of hGRα previously described (L733 and N734) were mutated to alanine [hGRα(6-7AA]. (A) Transactivation of MMTV-Luc and corresponding protein expression. (B) Nuclear localization of hGRα, hGRβ, and hGRα(6-7AA) in the absence and presence of Dex. Localization of hGRα(6-7AA) is the same as that of wt hGRα.
FIG. 8.
FIG. 8.
Structure predictions and molecular modeling. (A) A total of 12 secondary structure algorithms were run on the entire sequences of hGRα, hGRβ, hGRα(β6-7), and hGRα(1-742). The single-letter amino acid abbreviation for each receptor from residue 701 until the end is shown at the top of each sequence prediction block. Below the wt hGRα sequence is a comparison with the hPR. Below the hPR is the actual secondary structure found for the crystallographic solution of the hPR structure. The solid lines between hGR and hPR indicate a conserved amino acid. (B) Multiple sequence alignment of hGRα, hGRβ, and several other related receptors (hPR, hAR, hERα, and RXRγ). Alignment of hGRβ was done using the program Clustal W. Symbols underneath alignment indicate conserved residues. C) Three-dimensional models of hGRα, hGRβ, and hGRα(β6-7). Modeling was done using Molecular Simulations software. The common helices of each model (residues 525 to 727) are shown in red, the nonhomologous region from amino acid 728 through 742 is colored yellow, and the H12 region (residues 743 to 777), present in hGRα and hGRα(β6,7), is colored green. The hGRα model is shown with ligand occupying the binding pocket. The images also show the side chain orientations of residues 733 and 734 in each molecule.
FIG. 8.
FIG. 8.
Structure predictions and molecular modeling. (A) A total of 12 secondary structure algorithms were run on the entire sequences of hGRα, hGRβ, hGRα(β6-7), and hGRα(1-742). The single-letter amino acid abbreviation for each receptor from residue 701 until the end is shown at the top of each sequence prediction block. Below the wt hGRα sequence is a comparison with the hPR. Below the hPR is the actual secondary structure found for the crystallographic solution of the hPR structure. The solid lines between hGR and hPR indicate a conserved amino acid. (B) Multiple sequence alignment of hGRα, hGRβ, and several other related receptors (hPR, hAR, hERα, and RXRγ). Alignment of hGRβ was done using the program Clustal W. Symbols underneath alignment indicate conserved residues. C) Three-dimensional models of hGRα, hGRβ, and hGRα(β6-7). Modeling was done using Molecular Simulations software. The common helices of each model (residues 525 to 727) are shown in red, the nonhomologous region from amino acid 728 through 742 is colored yellow, and the H12 region (residues 743 to 777), present in hGRα and hGRα(β6,7), is colored green. The hGRα model is shown with ligand occupying the binding pocket. The images also show the side chain orientations of residues 733 and 734 in each molecule.

Similar articles

Cited by

References

    1. Allgood, V. E., R. H. Oakley, and J. A. Cidlowski. 1993. Modulation by vitamin B6 of glucocorticoid receptor-mediated gene expression requires transcription factors in addition to the glucocorticoid receptor. J. Biol. Chem. 268:: 20870-20876. - PubMed
    1. Baldi, P., S. Brunak, P. Frasconi, G. Soda, and G. Pollastri. 1999. Exploiting the past and the future in protein secondary structure prediction. Bioinformatics 15:937-946. - PubMed
    1. Bamberger, C. M., A. M. Bamberger, M. de Castro, and G. P. Chrousos. 1995. Glucocorticoid receptor beta, a potential endogenous inhibitor of glucocorticoid action in humans. J. Clin. Investig. 95:2435-2441. - PMC - PubMed
    1. Barroso, I., M. Gurnell, V. E. F. Crowley, M. Agostini, J. W. Schwabe, M. A. Soos, G. L. Maslen, T. D. M. Williams, H. Lewis, A. J. Schafer, V. K. K. Chatterjee, and S. O'Rahilly. 1999. Dominant negative mutations in human PPAR gamma associated with severe insulin resistance, diabetes mellitus and hypertension. Nature 402:880-883. - PubMed
    1. Bledsoe, R. K., V. G. Montana, T. B. Stanley, C. J. Delves, C. J. Apolito, D. D. McKee, T. G. Consler, D. J. Parks, E. L. Stewart, T. M. Willson, M. H. Lambert, J. T. Moore, K. H. Pearce, and H. E. Xu. 2002. Crystal structure of the glucocorticoid receptor ligand binding domain reveals a novel mode of receptor dimerization and coactivator recognition. Cell 110:93-105. - PubMed

MeSH terms

LinkOut - more resources