. 2003 Jun 10;100(12):7348-53.
doi: 10.1073/pnas.1131895100. Epub 2003 May 29.

Decoding neuronal spike trains: how important are correlations?

Affiliations

Decoding neuronal spike trains: how important are correlations?

Sheila Nirenberg et al. Proc Natl Acad Sci U S A. .

Abstract

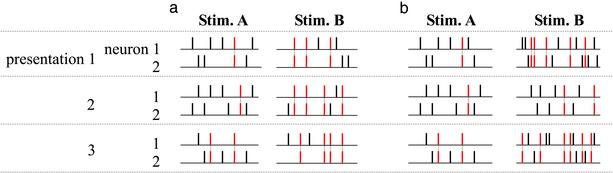
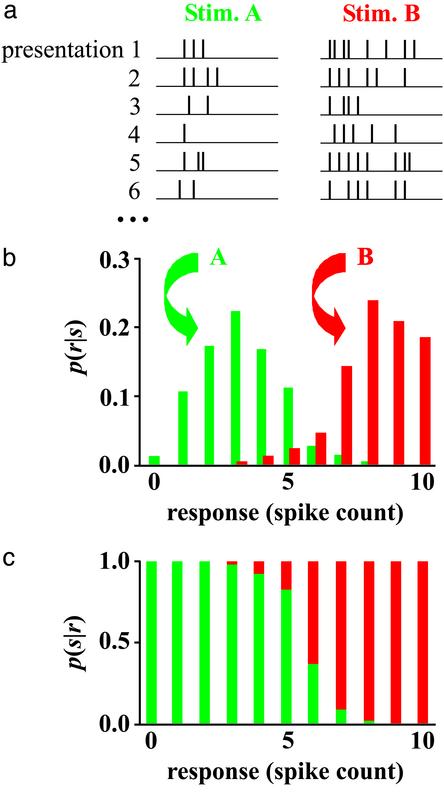
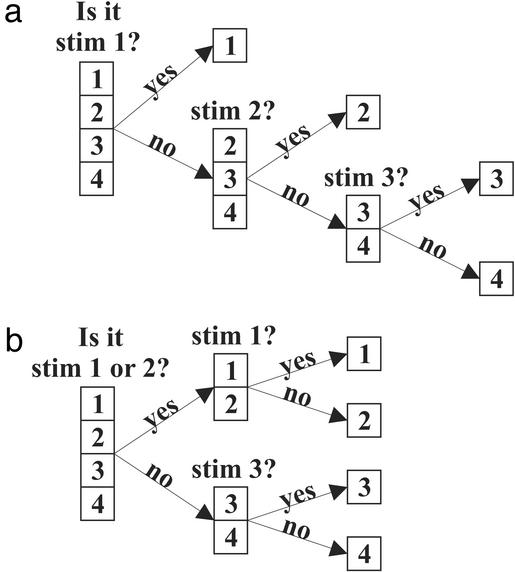
It has been known for >30 years that neuronal spike trains exhibit correlations, that is, the occurrence of a spike at one time is not independent of the occurrence of spikes at other times, both within spike trains from single neurons and across spike trains from multiple neurons. The presence of these correlations has led to the proposal that they might form a key element of the neural code. Specifically, they might act as an extra channel for information, carrying messages about events in the outside world that are not carried by other aspects of the spike trains, such as firing rate. Currently, there is no general consensus about whether this proposal applies to real spike trains in the nervous system. This is largely because it has been hard to separate information carried in correlations from that not carried in correlations. Here we propose a framework for performing this separation. Specifically, we derive an information-theoretic cost function that measures how much harder it is to decode neuronal responses when correlations are ignored than when they are taken into account. This cost function can be readily applied to real neuronal data.


Figures

Fig. 1.
Fig. 1.
Two scenarios: one in which correlations are critical for determining what the stimulus is, and one in which they are not. Shown are the results of a hypothetical experiment in which two stimuli, A and B, are presented several times, and the responses of two neurons are recorded. Synchronous spikes are marked in red and linked by a dashed gray line. (a) Both stimuli produce five spikes on average, but the number of synchronous spikes is higher for stimulus B than for A. Thus, knowledge of the difference in the degree of synchrony is needed to distinguish the stimuli. (b) Stimulus B produces, on average, more spikes than stimulus A (10 versus 5). The number of synchronous spikes is also higher for stimulus B but only because it is a function of spike count. Here, knowledge of the difference in the degree of synchrony is not needed to distinguish the stimuli; one can just use the difference in the spike count.
Fig. 2.
Fig. 2.
Determining p(s|r), the probability that a particular stimulus occurred given that a particular response occurred. Here the response, r, is the spike count of one neuron. (a) Outcome of six presentations for stimuli A (Left) and B (Right). (b) Histogram showing the probability that a particular response occurred given that a particular stimulus occurred. (c) Probability that each of the two stimuli occurred given that a particular response occurred, constructed using Eq. 1. Response is given on the horizontal axis; the lengths of the green and red bars are the probabilities that stimuli A and B occurred, respectively, given a response.
Fig. 3.
Fig. 3.
The stimulus distribution induces an optimal question-asking strategy. (a) Consider a distribution with four stimuli, numbered 1–4, and occurring with probabilities 1/2, 1/4, 1/8, and 1/8, respectively. A stimulus is drawn repeatedly from this distribution, and each time we must ask yes/no questions to determine what it is. The optimal question-asking strategy is to divide the probability in half with each question. Thus for this distribution, our first question is “is it stimulus 1?” If the answer is “no,” we then ask “is it stimulus 2?”, etc., until we arrive at the correct answer. With this strategy, stimulus 1 is guessed in one question, stimulus 2 in two, and stimuli 3 and 4 in three. On average, the number of questions we will ask to determine the stimuli is (1/2)1 + (1/4)2 + (1/8)3 + (1/8)3 = 1 3/4. (b) In this case, we do not know the stimulus probabilities and so make the assumption that they occur with equal probability. This wrong assumption would cause us to use a suboptimal question-asking strategy. Our first question would be “is it stimulus 1 or 2?” because that question would divide the assumed probabilities in half. However, that question does not divide the true probabilities in half. Continuing with this strategy, we see that all stimuli are guessed in two questions. The average number of questions is thus (1/2)2 + (1/4)2 + (1/8)2 + (1/8)2 = 2, which is greater than the average number shown in a.

References

    1. Adrian, E. D. & Zotterman, Y. (1926) J. Physiol. (London) 61, 465-483. - PMC - PubMed
    1. Richmond, B. J., Optican, L. M., Podell, M. & Spitzer, H. (1987) J. Neurophysiol. 57, 132-146. - PubMed
    1. Optican, L. M. & Richmond, B. J. (1987) J. Neurophysiol. 57, 162-178. - PubMed
    1. de Ruyter van Stevinick, R. R. & Bialek, W. (1988) Proc. R. Soc. London Ser. B 234, 379-414.
    1. Victor, J. D. & Purpura, K. P. (1996) J. Neurophysiol. 76, 1310-1326. - PubMed

Publication types

LinkOut - more resources