. 2003 May 30;300(5624):1430-4.
doi: 10.1126/science.1081919.

Disruption of the epithelial apical-junctional complex by Helicobacter pylori CagA

Affiliations

Disruption of the epithelial apical-junctional complex by Helicobacter pylori CagA

Manuel R Amieva et al. Science. .

Abstract

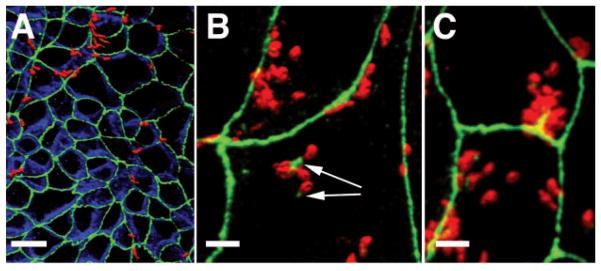
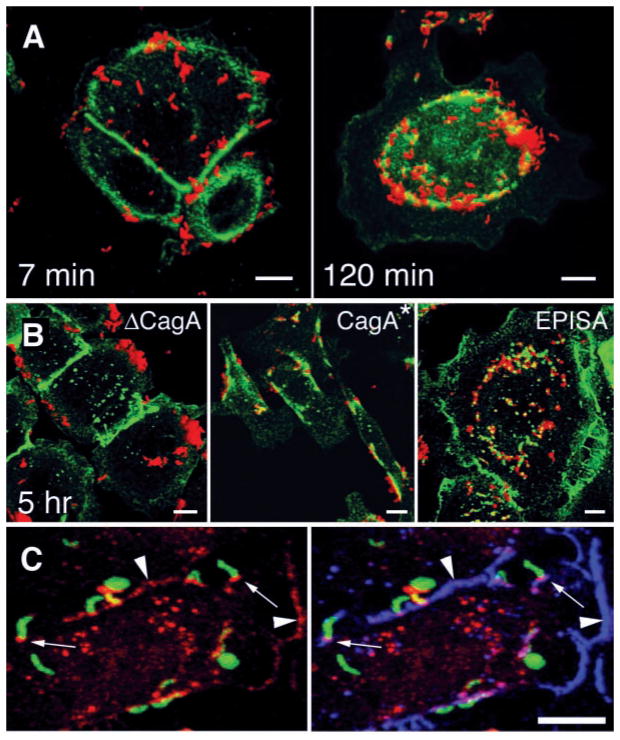
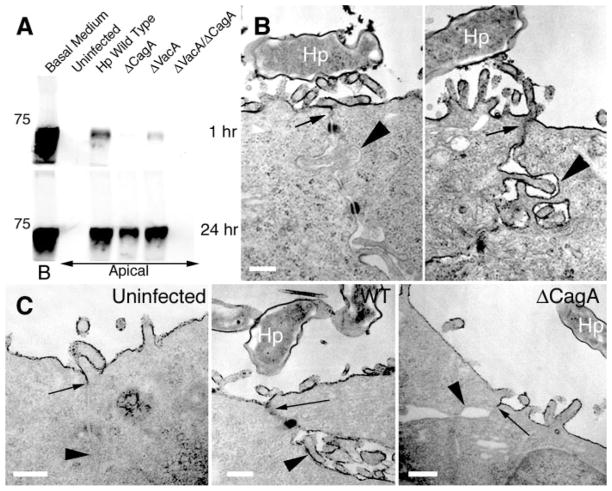
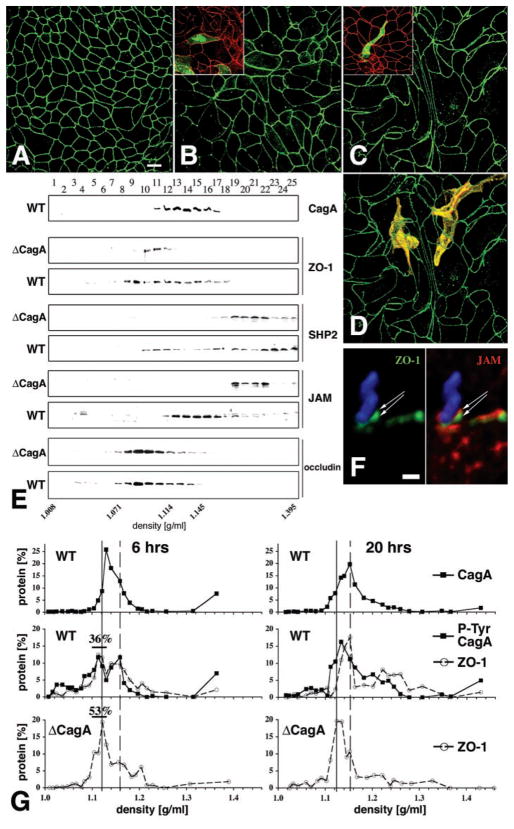
Helicobacter pylori translocates the protein CagA into gastric epithelial cells and has been linked to peptic ulcer disease and gastric carcinoma. We show that injected CagA associates with the epithelial tight-junction scaffolding protein ZO-1 and the transmembrane protein junctional adhesion molecule, causing an ectopic assembly of tight-junction components at sites of bacterial attachment, and altering the composition and function of the apical-junctional complex. Long-term CagA delivery to polarized epithelia caused a disruption of the epithelial barrier function and dysplastic alterations in epithelial cell morphology. CagA appears to target H. pylori to host cell intercellular junctions and to disrupt junction-mediated functions.


Figures

Fig. 1
Fig. 1
H. pylori associate with apical junctions of MDCK cells and alter the localization of tight-junction–associated proteins. Confocal immunofluorescence three-dimensional (3D) reconstructions of MDCK monolayers infected with H. pylori for 4 hours (A) or 8 hours (B and C), and stained with antibodies to ZO-1 (green), E-cadherin (blue), and H. pylori (red) are shown. Yellow areas indicate spatial overlap (colocalization) of the red-stained bacteria with the green ZO-1 signal. Arrows show ZO-1 recruited to extrajunctional sites of bacterial attachment in MDCK cells. Scale bar, 10 μm in (A) and 5 μm in (B) and (C).
Fig. 2
Fig. 2
CagA is required for colocalization of H. pylori and the tight-junction protein ZO-1. [(A) and (B)] Confocal immunofluorescence 3D reconstructions of AGS cells infected with wild-type H. pylori and isogenic mutants, and stained with antibodies to H. pylori (red) and ZO-1 (green). (A) AGS cells were infected for 5 min with H. pylori, washed, and incubated for 7 or 120 min before fixation and staining. (B) AGS cells were incubated for 5 hours with an isogenic mutant lacking the cagA gene (ΔCagA), with wild-type reconstituted strain G27 CagA*, and with a mutant expressing a form of CagA that cannot be phosphorylated in tyrosine residues (EPISA). (C) Confocal immunofluorescence 3D reconstructions of AGS cells infected for 2 hours with H. pylori and modified to express GFP (green), and stained with antibodies to CagA (red) and ZO-1 (blue). Yellow represents areas of GFP and CagA colocalization, which are especially intense in some bacteria that became permeabilized to the antibodies during the staining. Colocalization of CagA and ZO-1 is present at sites of bacterial attachment (small arrows) and at cell-cell contact sites (arrowheads). Scale bar, 5 μm.
Fig. 3
Fig. 3
Infection of MDCK monolayers with H. pylori causes disruption of tight-junction barrier function and prevents normal junction formation. (A) Diffusion of biotinylated albumin across infected MDCK monolayers. Confluent monolayers on Transwell filters were infected with H. pylori or isogenic mutants in the apical chamber. At day 10 after infection, media in the basolateral chambers were marked with biotinylated albumin (Basal Medium, B) and samples were collected 1 hour and 24 hours later from the apical chambers. After separation by SDS–polyacrylamide gel electrophoresis (SDS-PAGE), the amount of biotinylated albumin in the apical chambers was visualized with a streptavidin probe. A molecular weight marker of 75 kD is indicated. (B) Transmission electron micrographs of two junctional areas in an MDCK cell monolayer infected with H. pylori (Hp) for 3 days, and fixed in the presence of the electron-dense dye ruthenium red. (C) MDCK cells infected before junction formation with wild-type (WT) or ΔCagA H. pylori. After 24 hours of infection, formation of functional tight junctions was determined by ruthenium red exclusion from the basal-lateral space. Arrows point to the location of tight junctions. Arrowheads show comparative ruthenium red staining of basal-lateral membranes. Scale bar, 0.25 μm.
Fig. 4
Fig. 4
Effects of H. pylori infection on MDCK morphology and molecular organization of the apical-junctional complex. [(A) to (D)] Confluent monolayers of MDCK cells were infected with either nonadherent H. pylori (A), ΔcagA (B), or wild-type H. pylori (C) in continuous coculture for 7 days. Confocal immunofluorescence imaging of ZO-1 with an antibody to ZO-1 (green) outlines the shape of cell borders. (D) Optical sections of phalloidin staining (yellow) of actin were used to reconstruct the 3D shape of two cells within the monolayer infected with wild-type H. pylori. Similar experiments were done on a mixture of normal and GFP-expressing MDCK cells [insets in (B) and (C)]. Cells infected for 1 day with either wild-type [(C) inset] or ΔcagA [(B) inset] H. pylori were stained with anti–ZO-1 antibodies (red). The shape of single cells within the monolayer is revealed by GFP (green). (E) Membrane fractionation using 10–20–30% step iodixanol gradients. MDCK monolayers were infected for 5 days with wild-type or ΔcagA H. pylori. Twenty-five fractions of increasing density were separated by SDS-PAGE and the presence of CagA, ZO-1, SHP2, JAM, and occludin was determined by Western blot with appropriate antibodies. (F) Confocal immunofluorescence 3D reconstruction of an H. pylori (blue) adhered to the AGS cell surface for 4 hours and stained with antibodies to ZO-1 (green) and JAM (red). (G) Quantitative protein analysis of membrane fractions from MDCK cells during synchronized junction assembly. Bacteria and calcium were added simultaneously to noncontacting cells and incubated for 6 or 20 hours. Membrane fractions separated by density were subjected to SDS-PAGE and analyzed by Western blot for CagA, ZO-1, and phosphotyrosine. Protein distribution is plotted as the percentage of total signal for each protein. Percentages of ZO-1 at 6 hours represent the sum of protein signals between 1.104 and 1.130 g/ml (black bars). Solid line, lighter peak; dashed line, denser peak.

Comment in

References

    1. Peek RM, Jr, et al. Lab Invest. 1995;73:760. - PubMed
    1. Blaser MJ, et al. Cancer Res. 1995;55:2111. - PubMed
    1. Stein M, Rappuoli R, Covacci A. Proc Natl Acad Sci USA. 2000;97:1263. - PMC - PubMed
    1. Odenbreit S, et al. Science. 2000;287:1497. - PubMed
    1. Steer HW. Gut. 1984;25:1203. - PMC - PubMed

Publication types

MeSH terms

Substances