. 2003 May 29;22(22):3424-30.
doi: 10.1038/sj.onc.1206413.

Overexpression of Krüppel-like factor 4 in the human colon cancer cell line RKO leads to reduced tumorigenecity

Affiliations

Overexpression of Krüppel-like factor 4 in the human colon cancer cell line RKO leads to reduced tumorigenecity

Duyen T Dang et al. Oncogene. .

Abstract

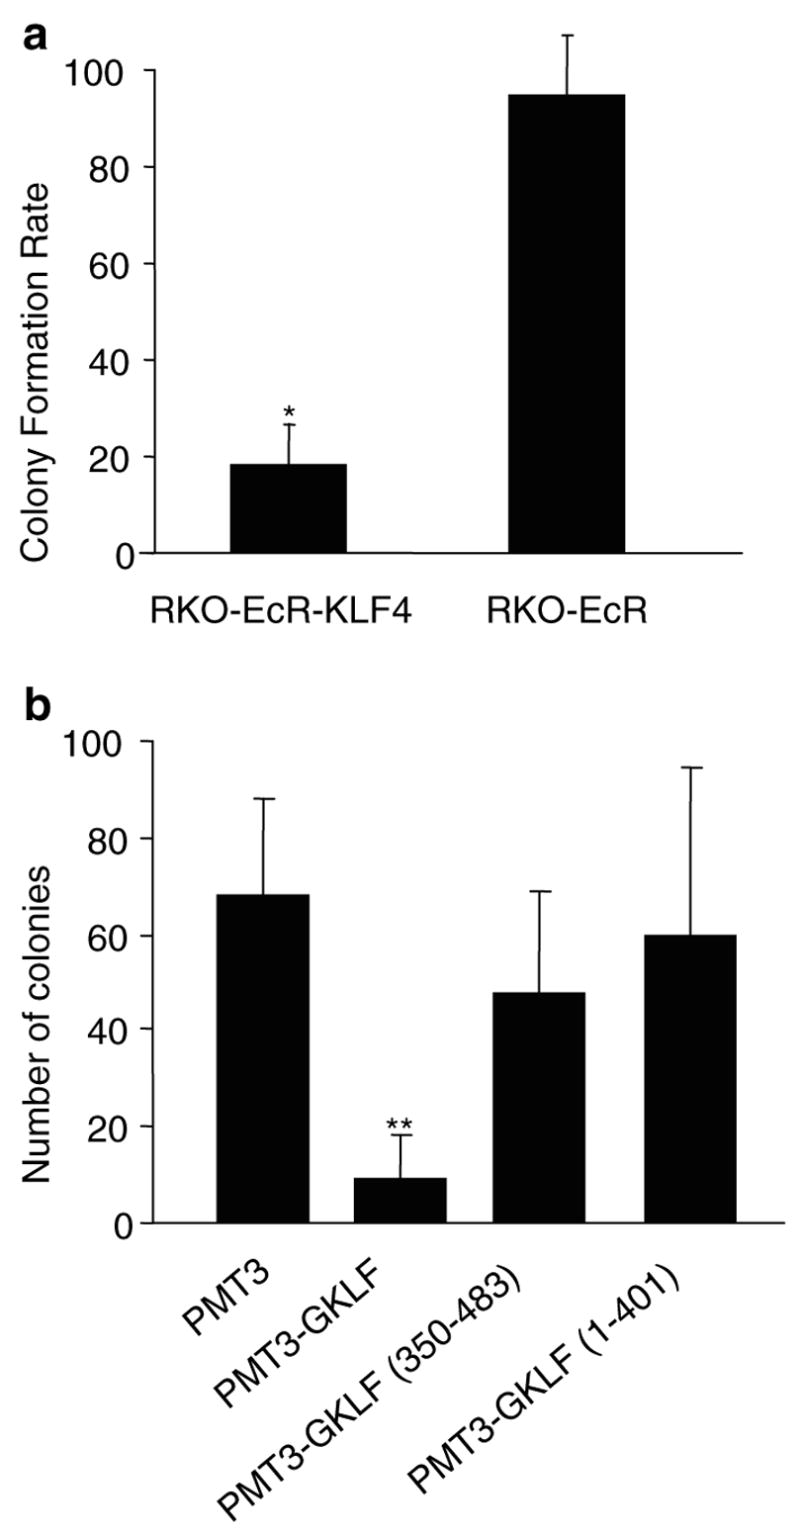
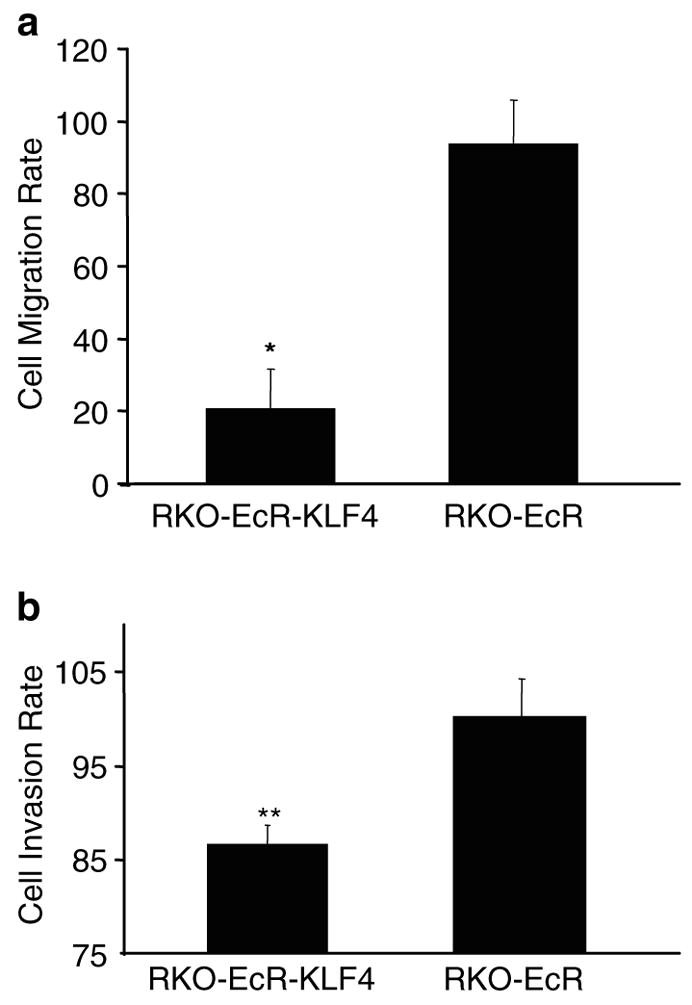
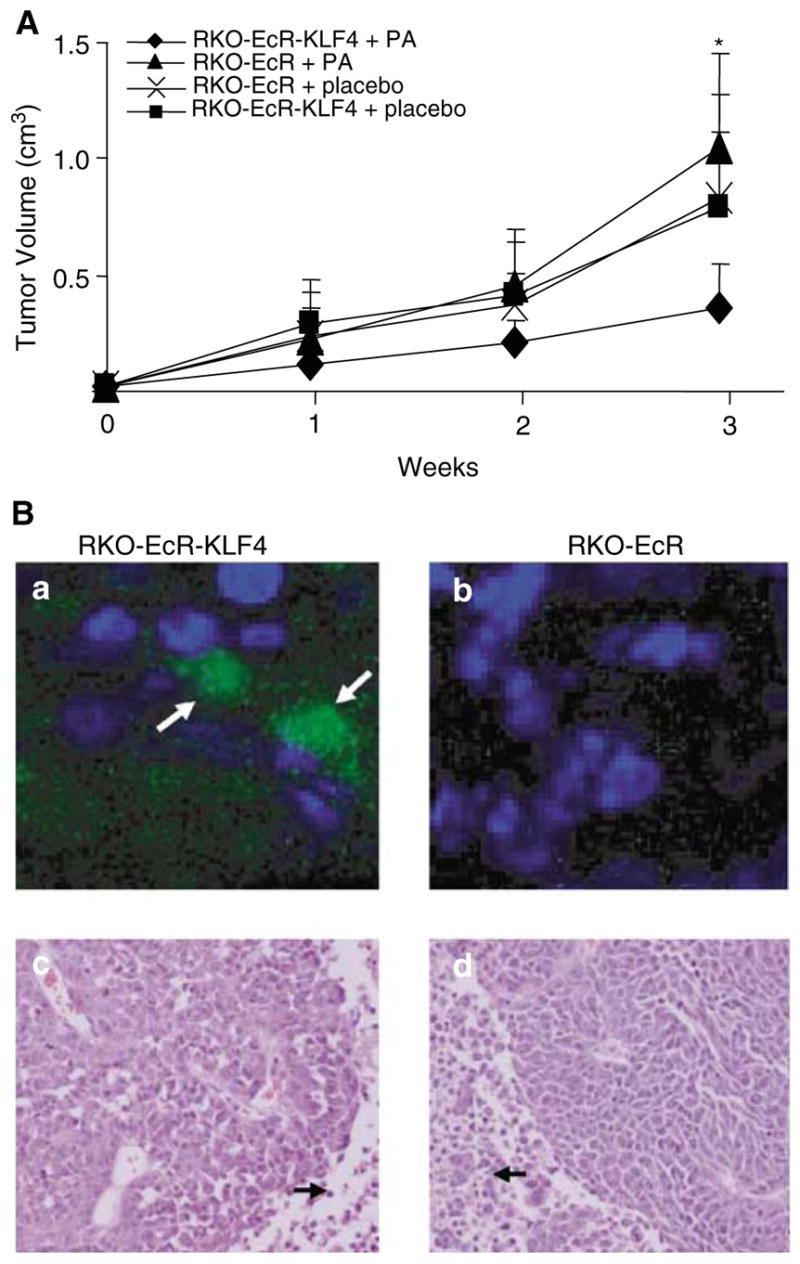
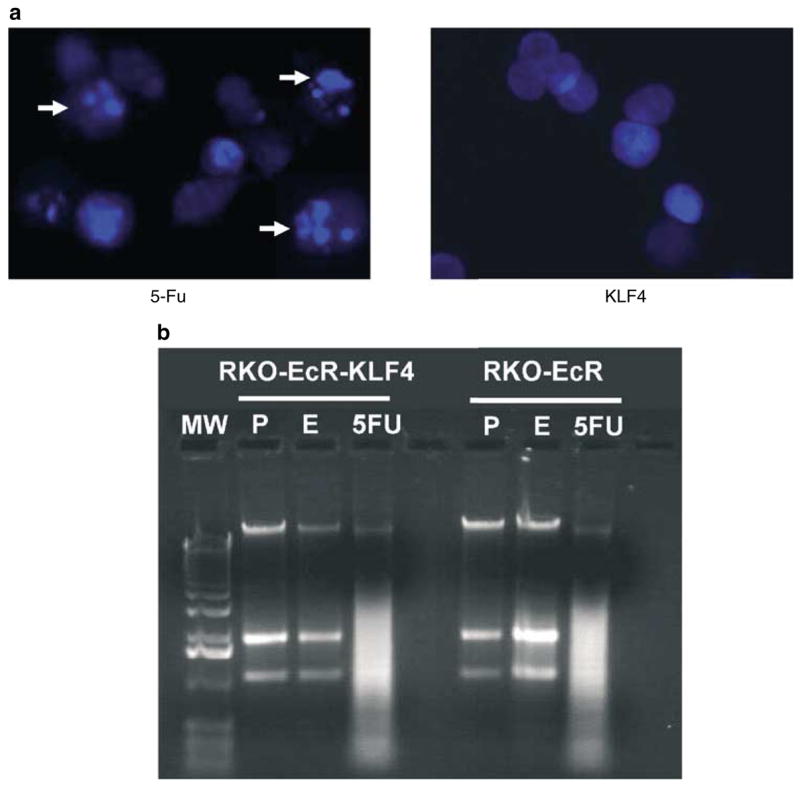
Krüppel-like factor 4 (KLF4) is a zinc-finger-containing transcription factor, the expression of which is enriched in the postmitotic cells of the intestinal epithelium. KLF4 is a target gene of the tumor suppressor adenomatous polyposis coli (APC). We sought to determine the role of KLF4 in suppressing the tumorigenecity of RKO colon cancer cells, which do not express KLF4. We utilized an established system in RKO cells, in which an inducible promoter controls expression of KLF4. Four independent assays were used to assess the effects of KLF4 induction on tumor cells. We find that KLF4 overexpression reduces colony formation, cell migration and invasion, and in vivo tumorigenecity. The mechanism of action of KLF4 does not involve apoptosis. These findings, along with our previous findings that KLF4 induces G1/S arrest, suggest that KLF4 is a cell cycle checkpoint protein that can reduce tumorigenecity of colon cancer cells.


Figures

Figure 1
Figure 1
Effect of KLF4 induction on colony formation. (a) Anchorage-independent colony formation. For each cell type (RKO-EcR- KLF4 or RKO-EcR), the colony formation rate was calculated by dividing the number of spherical colonies in each Ponasterone A-treated well (induced condition) by the number of colonies in the corresponding ethanol-treated well (uninduced condition), and multiplied by 100. Treatment of RKO-EcR-KLF4 cells with 5 μm Ponasterone A results in overexpression of KLF4 (Chen et al., 2001). Two-tailed Student’s t-test was used to determine whether the differences in rates of colony formation between the two different cell types, RKO-EcR-KLF4 versus RKO-EcR were statistically significant. Each value is the average of three triplicate dishes, *P < 0.0001. RKO-EcR-KLF4 and RKO-EcR cells were treated with either 5 μm Ponasterone A or equal volume of ethanol (the vehicle in which Ponasterone A is suspended), suspended in 0.33% agar in complete growth medium, and plated on six-well plates layered with 0.5% agar in complete growth medium at a concentration of 2.0 × 10⁴ cells/well. Cells were allowed to grow for 2 weeks and spherical colonies counted. Complete growth medium consisted of Dubelco’s minimal essential media (DMEM) supplemented with 10% fetal bovine serum (FBS), 100 U/ml penicillin, 100 μg/ml of streptomycin, and 150 μg/ml Zeocin (Invitrogen). Ponasterone A was obtained from Invitrogen as a powder and resuspended as per the manufacturer’s directions in 100% ethanol. (b) Colony suppression assays with different KLF4 residues. RKO cells were cotransfected (50 : 1) with 980 ng/six-well dish of PMT3, PMT3- KLF4 (full-length KLF4), PMT3-KLF4 (350–483), which contains the C-terminal nuclear localizing signal and three zinc-fingers, or PMT3- KLF4 (1–401), which contains the N-terminal region including the nuclear localization signal but excluding the zinc-fingers and 20 ng/six-well dish of pBabe Puro as previously described (Geiman et al., 2000). 2 days following transfection, cells were fed complete media containing 0.75 μg/ml puromycin (Sigma, St Louis, MO, USA) for 2 weeks. Resistant colonies of cells were stained with 0.1% crystal violet and counted using Scion image software for Windows (www.scioncorp.com). Each value represents the mean number of colonies for six wells. **P < 0.01 by two-tailed Student’s t-test between PMT3- and PMT3- KLF4-transfected cells. All transfections were performed using the Lipofectamine reagent protocol (Invitrogen) on 10–15% confluent RKO cells
Figure 2
Figure 2
Effect of KLF4 induction on cell migration and invasion. For each cell type, RKO-EcR-KLF4 or RKO-EcR, cell migration and invasion rates were calculated by dividing the number of migrating or invading cells in the induced condition by the number in the corresponding uninduced condition, and multiplied by 100. KLF4 is induced only in RKO-EcR-KLF4 cells treated with Ponasterone A. Means and standard deviations of cell migration and invasion rates were calculated and plotted. Two-tailed Student’s t-test was used to determine whether the differences in rates of migration or invasion between the two different cell types, RKO-EcR-KLF4 versus RKO-EcR, were statistically significant. All migration and invasion assays were performed in triplicate wells and repeated twice. *P < 0.0001, **P < 0.01. (a) Cell migration was assayed in six-well plates with an 8.0 μm pore size polycarbonate membrane (Transwell, Costar, Cambridge, MA, USA) as previously described (Pouliot et al., 2001). Briefly, the membranes were rinsed twice with phosphate-buffered saline (PBS) and allowed to equilibrate in DMEM over 24 h. Thereafter, the lower chamber was filled with 2.6 ml of complete media (DMEM, antibiotics, and 10% FBS). The upper chamber was filled with 1.5 ml of serum-free medium and 1.0 × 10⁵ RKO-EcR or RKO-EcR-KLF4 cells treated with either 5 μm Ponasterone A or equal volume of ethanol. The plates were incubated at 37°C. After 6 h, cells in the culture medium from the lower chamber were collected and strongly adherent cells on the underside of the membrane and bottom of the lower chamber were detached with trypsin and pooled. The cells were pelleted and the number of migrated cells counted on a hemocytometer. To assess for cell proliferation, the cells on the upper chamber were detached with trypsin and counted on a hemocytometer. The total number of cells at the end of 6 h was roughly equivocal to the number plated. (b) Tumor cell invasion was assayed using six-well plates with an 8.0 μm pore size polycarbonate membrane coated with Matrigel Matrix (BD Biosciences, Chicago, IL, USA) as previously described (Rozic et al., 2001). Briefly, the lower chamber was filled with 2.6 ml of complete media (DMEM, antibiotics, and 10% FBS). The upper chamber was filled with 1.5 ml of serum-free medium and 1 × 10⁵ RKO-EcR or RKO-EcR-KLF4 cells treated with either 5 μm Ponasterone A or equal volume of ethanol. The plates were incubated at 37°C. After 6 h, cells remaining on the upper surface of the membrane were removed with a cotton swab. The membranes were then fixed and stained with the Diff Quik staining kit (Dade AG, Dudingen, Switzerland). Membranes were removed from transwells, mounted on glass slides, and cells counted under a light microscope (an average of five random nonoverlapping fields at 400 × magnification)
Figure 3
Figure 3
Effect of KLF4 induction on in vivo tumor growth. (a) In vivo tumor growth of RKO-EcR and RKO-EcR-KLF4 cells treated with Ponasterone A (PA) or placebo in athymic mice. KLF4 is induced only in RKO-EcR-KLF4 cells treated with PA. The other three conditions are negative controls. 1.0 × 10⁶ RKO-EcR and RKO-EcR-KLF4 cells were harvested, treated accordingly with 5 μm PA or ETOH, and inoculated subcutaneously in the flanks of 6-week-old female athymic nu/nu mice (Charles River Labs, Wilmington, MA, USA). Each mouse served as its own control, since RKO-EcR cells were injected on the left flank and RKO-EcR-KLF4 cells on the right flank. Mice were subsequently treated twice per week with intraperitoneal injections of either 5.0 mg PA dissolved in DMSO and mixed with 100–150 μl of sesame oil or equal volume of DMSO mixed with sesame oil as previously reported (No et al., 1996). Tumor sizes in two dimensions were measured weekly, and volumes were calculated with the formula (L × W2) × 0.5, where L is the length and W is the width. At the end of 3 weeks, mice were euthanized (because of tumor burden) and the tumor xenografts harvested for imaging. Mice were housed in barrier environments, with food and water provided ad libitum as approved by the Johns Hopkins Animal Care and Use Committee. Means and standard deviations of tumor volumes were calculated and plotted. Two-tailed Student’s t-test was used to determine statistical significance between groups. *P < 0.05 between RKO-EcR-KLF4 (-♦-) and RKO-EcR (-▲-) in mice treated with PA. Each experimental group was composed of 10 mice and was repeated once (total N = 20 for each group). (b) Top panel: confocal photomicrographs of 3-week-old explanted (a) RKO-EcR-KLF4 and (b) RKO-EcR xenografts from mice treated with PA, which induces KLF4 and EGFP in RKO-EcR-KLF4 cells only. Nuclei are stained blue with Hoechst solution. Arrows point to EGFP in a subset of RKO-EcR-KLF4 cells. Tumor explants from mice were frozen in OCT compound (Tissue-Tek) and sectioned onto glass slides with a cryostat. Sections were then fixed in 0.05% glutaraldehyde in PBS for 10 min and stained with 0.1% Hoechst 33258 (Sigma) in solution with 3.7% formaldehyde and 0.5% Nonidet P-40 in PBS. Sections were then washed in Tris-buffered saline with 0.1% Triton X-100 (TBST) for 5 min, twice in distilled water for 2 min, mounted with Fluorescent Mounting Medium (Dako, Carpinteria, CA, USA), and visualized under confocal microscopy. (b) Bottom panel: light photomicrographs ( × 20) of 3-week old explanted (c) RKO-EcR-KLF4 and (d) RKO-EcR xenografts from mice treated with PA. Representative sections from both tumor types demonstrate poorly differentiated carcinoma. Essentially no inflammatory infiltrate is seen and the tumor is homogenous in appearance. Scattered mitoses and occasional apoptotic bodies are present. The central portions of the neoplasms (arrows) show tumor necrosis. Tumor explants from mice were fixed in 4% paraformaldehyde, paraffin embedded, sectioned, and stained with hematoxylin and eosin by the Johns Hopkins Comparative Pathology Department
Figure 4
Figure 4
Effect of KLF4 induction on apoptosis. (a) Fluorescence photomicrograph of RKO-EcR-KLF4 cells treated with 5-FU to induce apoptosis or Ponasterone A to induce KLF4. Cells treated with 5-FU show chromatin condensation, nuclear fragmentation, and apoptotic bodies (arrows), all morphological hallmarks of apoptosis. For these studies, RKO-EcR-KLF4 cells were treated with 5 μm Ponasterone A or 50 μg/ml 5-fluorouracil (5-FU, Sigma) for 3 days, fixed with a solution containing 0.1% Hoechst, 3.7% formaldehyde, and 0.5% Nonidet P-40 in PBS and visualized under fluorescence microscopy. Both floating and adherent cells were collected for evaluation. (b) Representative electrophoresis of genomic DNA from RKO-EcR and RKO-EcR-KLF4 cells treated with 5 μm Ponasterone A (P), ethanol (E), or 5-FU for 72 h. Lane 1 depicts the 1kb molecular weight (MW) marker. With 5-FU treatment, the typical ladder pattern, often associated with apoptosis, is seen. Genomic DNA was obtained from 2.0 × 10⁶ RKO-EcR and RKO-EcR-KLF4 cells treated with 5 μm Ponasterone A, equal volume ethanol, or 50 μg/ml 5-FU for 3 days using the Apoptotic DNA Ladder Kit (Roche, Basel, Switzerland). DNA was extracted from both floating and adherent cells. DNA was visualized in a 2.0% agarose gel with 0.1 μg/ml ethidium bromide. Similar results were obtained in cells treated with 5 or 10 μm Ponasterone A; thus only results with 5 μm treatments are shown

Similar articles

Cited by

References

    1. Adam PJ, Regan CP, Hautmann MB, Owens GK. J Biol Chem. 2000;275:37798–37806. - PubMed
    1. Behr R, Kaestner KH. Mech Dev. 2002;115:167–169. - PubMed
    1. Brembeck FH, Rustgi AK. J Biol Chem. 2000;275:28230–28239. - PubMed
    1. Chen X, Johns DC, Geiman DE, Marban E, Dang DT, Hamlin G, Sun R, Yang VW. J Biol Chem. 2001;276:30423–30428. - PMC - PubMed
    1. Chen ZY, Shie J, Tseng C. FEBS Lett. 2000;477:67–72. - PubMed

Publication types