Large-scale comparison of intron positions in mammalian genes shows intron loss but no gain
- PMID: 12777620
- PMCID: PMC165846
- DOI: 10.1073/pnas.1232297100
Large-scale comparison of intron positions in mammalian genes shows intron loss but no gain
Abstract
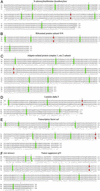
We compared intron-exon structures in 1,560 human-mouse orthologs and 360 mouse-rat orthologs. The origin of differences in intron positions between species was inferred by comparison with an outgroup, Fugu for human-mouse and human for mouse-rat. Among 10,020 intron positions in the human-mouse comparison, we found unequivocal evidence for five independent intron losses in the mouse lineage but no evidence for intron loss in humans or for intron gain in either lineage. Among 1,459 positions in rat-mouse comparisons, we found evidence for one loss in rat but neither loss in mouse nor gain in either lineage. In each case, the intron losses were exact, without change in the surrounding coding sequence, and involved introns that are extremely short, with an average of 200 bp, an order of magnitude shorter than the mammalian average. These results favor a model whereby introns are lost through gene conversion with intronless copies of the gene. In addition, the finding of widespread conservation of intron-exon structure, even over large evolutionary distances, suggests that comparative methods employing information about gene structures should be very successful in correctly predicting exon boundaries in genomic sequences.
Figures
References
Publication types
MeSH terms
Substances
LinkOut - more resources
Full Text Sources
Other Literature Sources


