. 2003 Jun 10;100(12):7319-24.
doi: 10.1073/pnas.1232232100. Epub 2003 May 30.

In vivo two-photon calcium imaging of neuronal networks

Affiliations

In vivo two-photon calcium imaging of neuronal networks

Christoph Stosiek et al. Proc Natl Acad Sci U S A. .

Abstract

Two-photon calcium imaging is a powerful means for monitoring the activity of distinct neurons in brain tissue in vivo. In the mammalian brain, such imaging studies have been restricted largely to calcium recordings from neurons that were individually dye-loaded through microelectrodes. Previous attempts to use membrane-permeant forms of fluorometric calcium indicators to load populations of neurons have yielded satisfactory results only in cell cultures or in slices of immature brain tissue. Here we introduce a versatile approach for loading membrane-permeant fluorescent indicator dyes in large populations of cells. We established a pressure ejection-based local dye delivery protocol that can be used for a large spectrum of membrane-permeant indicator dyes, including calcium green-1 acetoxymethyl (AM) ester, Fura-2 AM, Fluo-4 AM, and Indo-1 AM. We applied this dye-loading protocol successfully in mouse brain tissue at any developmental stage from newborn to adult in vivo and in vitro. In vivo two-photon Ca2+ recordings, obtained by imaging through the intact skull, indicated that whisker deflection-evoked Ca2+ transients occur in a subset of layer 2/3 neurons of the barrel cortex. Thus, our results demonstrate the suitability of this technique for real-time analyses of intact neuronal circuits with the resolution of individual cells.


Figures

Fig. 1.
Fig. 1.
In vivo calcium imaging of neuronal populations. (A) Schematic drawing of the experimental arrangement. (B) Images taken through a thinned skull of a P13 mouse at increasing depth. (C) Spontaneous Ca2+ transients recorded in a different experiment through a thinned skull in individual neurons (P5 mouse) located 70 μm below the cortical surface, from a region similar to that shown in B. (D) Images obtained as in B in an experiment (P13 mouse) in which the skull was removed before imaging.
Fig. 2.
Fig. 2.
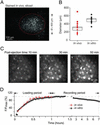
Effectiveness and time-course of the staining procedure. (A) Image of the stained area in a cortical slice obtained from a P13 mouse (×20 objective). The cells were stained in vivo, and the brain was then removed and sliced. (B) Box plot of data illustrating the diameter of the stained area in different experiments. Each symbol marks a separate experiment. Squares (n = 10) represent cortices stained and imaged in vivo, and circles represent cortices imaged in vitro and stained either in vivo (n = 3, red symbols) or in vitro (n = 10, black symbols). (C) Consecutive images taken in vivo at 90-μm depth 10, 30, and 50 min after ejection (1 min) of 1 mM OG-1 AM into the cortex of a P14 mouse. (D) Normalized mean fluorescence intensity as a function of postejection time. The plot summarizes data obtained in seven in vivo (red squares) and nine in vitro (black circles) experiments (left part of the graph) and in three in vitro (black circles) experiments (right part of the graph).
Fig. 3.
Fig. 3.
In vitro staining of the adult mouse cortex. (A Left) An overview (taken with a ×20 objective) of the area in a cortical slice from a P71 mouse stained with magnesium green AM. (Right) A maximal projection of 10 images taken with a ×60 objective from 50 to 60 μm underneath the slice surface. The imaged area is delimited by the square area indicated in Left. (B) Line-scan recordings of Ca2+ transients in a neuron (marked with a white circle in A Right), evoked by three consecutive 350-ms iontophoretic glutamate applications. (C) Layer 2/3 cells in a cortical slice stained in vitro with OG-1 AM. After staining, one cell was patched and perfused with an intracellular solution containing 20 μM OG-1 hexapotassium salt. (D) Histogram illustrating the distribution of the estimated OG-1 concentration in neurons stained by using the MCBL technique.
Fig. 4.
Fig. 4.
In vivo and in vitro comparison of glutamate-evoked Ca2+ transients. (A Upper) A high-magnification image of layer 2/3 neurons in vivo in the cortex of a P13 mouse. (Lower) Ca2+ transients in three individual neurons (marked in Upper) evoked by five consecutive 500-ms iontophoretic glutamate applications. (B Upper) In vivo stained layer 2/3 neurons from the same mouse as in A visualized in vitro in a cortical slice. (Lower) Ca2+ transients in three individual neurons evoked by iontophoretic glutamate applications in control, in the presence of 10 μM 6-cyano-7-nitroquinoxaline-2,3-dione (CNQX) and 50 μM dl-2-amino-5-phosphonovaleric acid (APV), and 20 min after wash-out of the drugs. (C) Line-scan Ca2+ measurements and simultaneous recordings of membrane potential changes evoked by a 500-ms iontophoretic glutamate application in a whole-cell patch-clamped layer 2/3 pyramidal neuron.
Fig. 5.
Fig. 5.
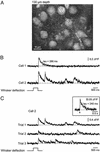
In vivo recordings of Ca2+ transients evoked by whisker deflection. (A) A high-magnification image of layer 2/3 neurons in vivo in the barrel cortex of a P13 mouse. (B) Line-scan recordings of Ca2+ transients evoked in two neurons by a deflection of the majority of whiskers on the contralateral side of the mouse's snout. The position of the scanned line and the cells analyzed are indicated in A. Note that the Ca2+ transients occurred 17–22 ms after the termination of the stimulus and therefore probably represent stimulus-offset responses (42). Here and in C, the solid line represents a mono-exponential fit of the decay phase of the transient. (C)Ca2+ transients evoked in cell 2 during three consecutive trials. The top trace is from the trial illustrated in B. (Inset) A Ca2+ transient in a P14 layer 2/3 neuron evoked in vivo by single-shock electrical stimulation (70 V, 200 μs, average of five consecutive trials).

Similar articles

Cited by

References

    1. Nicolelis, M. & Ribeiro, S. (2002) Curr. Opin. Neurobiol. 12, 602-606. - PubMed
    1. Shoham, D., Glaser, D. E., Arieli, A., Kenet, T., Wijnbergen, C., Toledo, Y., Hildesheim, R. & Grinvald, A. (1999) Neuron 24, 791-802. - PubMed
    1. Raichle, M. E. (1998) Proc. Natl. Acad. Sci. USA 95, 765-772. - PMC - PubMed
    1. Orbach, H. S., Cohen, L. B. & Grinvald, A. (1985) J. Neurosci. 5, 1886-1895. - PMC - PubMed
    1. Grinvald, A., Frostig, R. D., Lieke, E. & Hildesheim, R. (1988) Physiol. Rev. 68, 1285-1366. - PubMed

Publication types