. 2003 Jun;132(3):509-16.
doi: 10.1046/j.1365-2249.2003.02180.x.

Beta-2-glycoprotein I expression on monocytes is increased in anti-phospholipid antibody syndrome and correlates with tissue factor expression

Affiliations

Beta-2-glycoprotein I expression on monocytes is increased in anti-phospholipid antibody syndrome and correlates with tissue factor expression

F Conti et al. Clin Exp Immunol. 2003 Jun.

Abstract

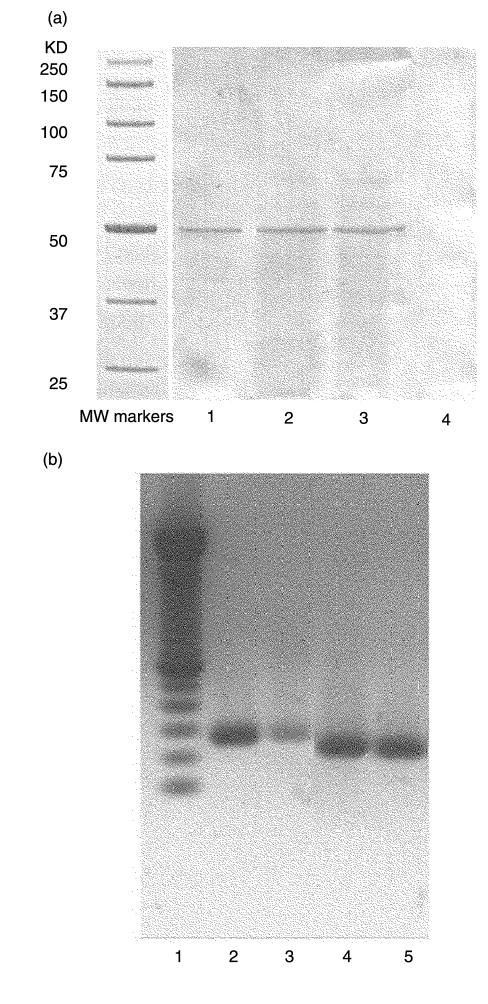
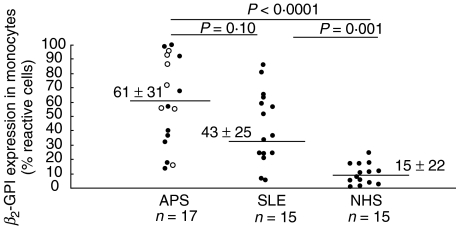
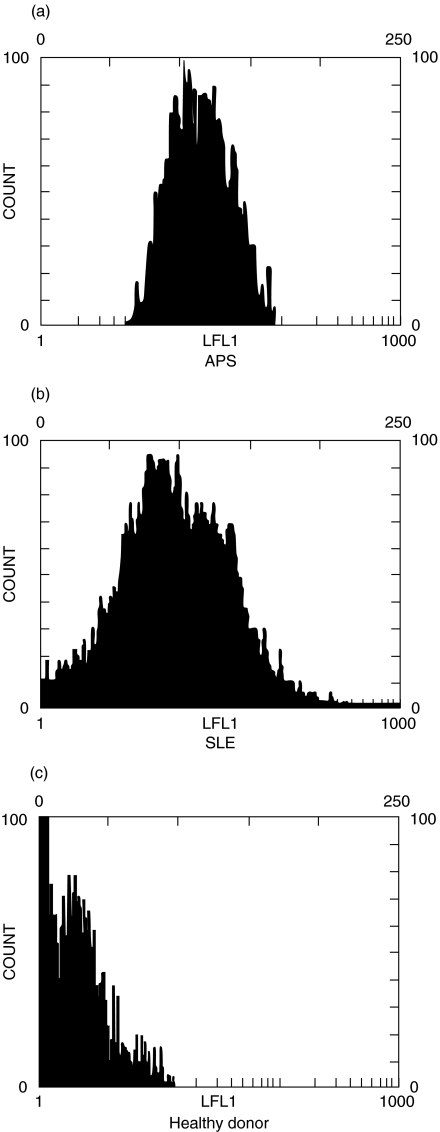
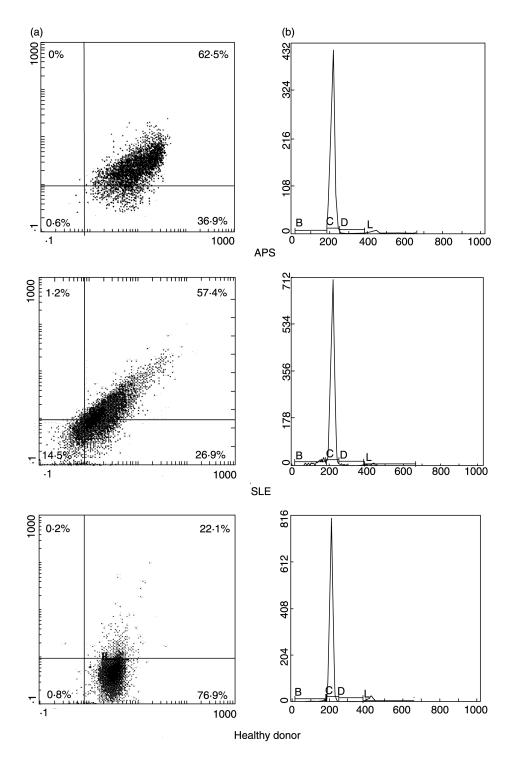
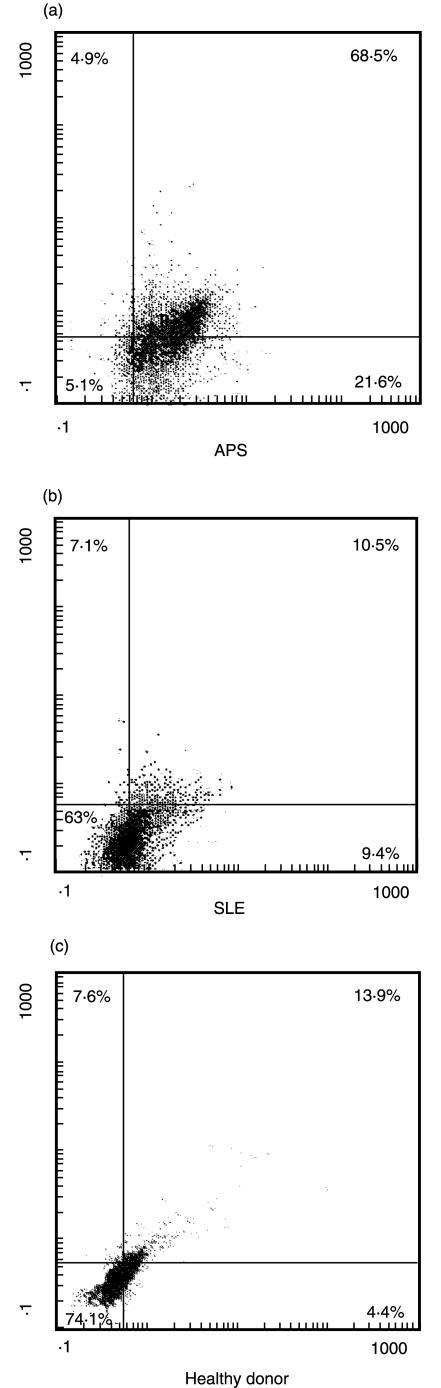
It is well known that monocytes may play an active role in thrombogenesis, since they may express on their surface tissue factor, the major initiator of the clotting cascade. The results of this investigation demonstrate beta-2-glycoprotein I (beta2-GPI) mRNA expression by human peripheral blood monocytes, indicating that these cells synthesize beta2-GPI. In addition, we show beta2-GPI expression on cell surface of these cells by flow cytometric analysis, and the presence of this protein in cell lysate by Western blot. Interestingly, beta2-GPI expression on monocytes is significantly increased in patients with anti-phospholipid syndrome (APS) or systemic lupus erythematosus (SLE) as against healthy blood donors and correlates with tissue factor expression on monocytes. These findings support the view that monocytes are able to synthesize beta2-GPI and suggest that patients with APS may have increased beta2-GPI exposure on cell surface, which leads to persistently high monocyte tissue factor expression and consequently to a prothrombotic diathesis.


Figures

Fig. 1
Fig. 1
(a) Western blot analysis of β2-GPI expression in human monocytes. Monocytes were washed with RPMI 1640 and placed in serum-free medium, containing 5 mM insulin, 5 mM transferrine, 100 U/ml penicillin, 100 mg/ml streptomycin and 250 pg/ml fungizone, 2 mM L-glutamine for 24 h at 37°C in a humidified 5% CO2 atmosphere. Whole cells were lysed in lysis buffer. The proteins were separated by 10% SDS-PAGE, electrophoretically transferred to nitrocellulose membrane and then probed with polyclonal anti-human β2-GPI. Bound antibodies were then visualized with peroxidase-conjugated anti-rabbit IgG. The colour reaction was obtained by sodium nitroprusside. Lane 1: standard β2-GPI, 2 µg; lane 2: monocytes placed in serum-free medium without FCS; lane 3: monocytes placed in medium with 10% FCS; lane 4: human skin fibroblasts. (b) Reverse transcriptase-polymerase chain reaction (RT-PCR) products of mRNAs for β2-GPI from human monocytes. Lane 1: 50-bp DNA ladder: lane 2: RT-PCR products of mRNAs for β2-GPI from HepGL2; lane 3: RT-PCR products of mRNAs for β2-GPI from human monocytes; lane 4: RT-PCR products of mRNAs for β-actin from HepGL2; lane 5: RT-PCR products of mRNAs for β-actin from human monocytes. The RT-PCR of RNAs results in amplification of the expected bands: 262 bp for β2-GPI, 218 bp for β-actin.
Fig. 2
Fig. 2
β2-GPI expression on human monocyte cell surface (% reactive cells), as detected by cytofluorimetric analysis. β2-GPI expression on monocytes from patients with APS (17 samples), 7 of which primary APS (○) and 10 secondary to SLE (•), patients with SLE (15 samples) and healthy donors (NHS) (15 samples) are shown. Means ± standard deviation.
Fig. 3
Fig. 3
Cytofluorimetric analysis of β2-GPI expression on human monocyte cell surface. The cells were stained with polyclonal anti-human β2-GPI. Dot plots (SSC/FSC) represent log fluorescence versus cell number, gated on cell population of a side scatter/forward scatter (SS/FS) histogram. Cell number is indicated on the y-axis and fluorescence intensity is represented in three logarithmic units at the x-axis. (a) β2-GPI expression on monocytes from a patient with APS; (b) β2-GPI expression on monocytes from a patient with SLE; (c) β2-GPI expression on monocytes from a healthy donor.
Fig. 4
Fig. 4
(a) Cytofluorimetric analysis of CD14 and β2-GPI. Monocytes were stained with polyclonal anti-human β2GPI plus PE-conjugated anti-rabbit IgG and then counterstained with FITC-conjugated anti-CD14 MoAb. Dot plots (SSC/FSC) represent log fluorescence. Green (FITC) fluorescence is indicated on the x-axis and red fluorescence (PE) is represented on the y-axis. The line indicates the background autofluorescence: upper left panel: β2GPI+CD14- cells; upper right panel: β2GPI+CD14+ cells; lower left panel: β2GPI-CD14-; lower right panel: β2GPI-CD14+ cells. One example representative of all the patients under test. β2-GPI expression on monocytes from a patient with APS or SLE is significantly higher as compared to those from a healthy donor. (b) Cells were fixed with 70% ethanol and, after adding RNAse, were stained with propidium iodide. A subdiploid peak in flow cytometry histograms (cursor B) identifies DNA fragmentation as the typical nuclear change that defines apoptosis. Cursor C reveals the diploid peak, cursor D the hyperdiploid peak and cursor L the tetraploid peak. Cell number is indicated on the y-axis and fluorescence intensity is represented at the x-axis. The cytofluorimetric analysis of DNA staining with propidium iodide showed a subdiploid peak of fluorescence of 2·6% for the patient with APS, 7·0% for the patient with SLE and 1·6% for the healthy donor. One example representative of all the subjects under test.
Fig. 5
Fig. 5
Cytofluorimetric analysis of tissue factor expression in anti-β2-GPI positive cells. Monocytes were stained with polyclonal anti-human β2GPI plus PE-conjugated anti-rabbit IgG and then counterstained with FITC-conjugated anti-tissue factor MoAb. Dot plots (SSC/FSC) represent log fluorescence. Green (FITC) fluorescence is indicated on the x-axis and red fluorescence (PE) is represented on the y-axis. The line indicates the background autofluorescence: upper left: β2GPI+TF- cells; upper right: β2GPI+TF+ cells; lower left: β2GPI-TF-; lower right: β2GPI-TF+ cells. (a) monocytes from a patient with APS; (b) monocytes from a patient with SLE; (c) monocytes from a healthy donor. In monocytes obtained from APS patients a very strong association between the two staining was observed (β2GPI+TF+ cells: 68·5%versus β2GPI+TF- cells: 4·9% and β2GPI-TF+ cells: 21·6%; P < 0·001). One example representative of all the patients under test.

References

    1. Hughes GRV. The anticardiolipin syndrome. Clin Exp Rheumatol. 1985;3:285–6. - PubMed
    1. Hughes GRV, Harris EN, Gharavi AE. The anticardiolipin syndrome. J Rheumatol. 1986;13:486–9. - PubMed
    1. Wilson WA, Gharavi AE, Koike T, et al. International consensus statement on preliminary classification criteria for definite antiphospholipid syndrome. Arthritis Rheum. 1999;42:1309–11. - PubMed
    1. Galli M, Confurius P, Maassen C, et al. Anticardiolipin antibodies (ACA) directed not to cardiolipin but to a plasma protein cofactor. Lancet. 1990;355:1544–7. - PubMed
    1. Hunt J, Krilis S. The fifth domain of β2-glycoprotein I contains a phospholipid binding site (Cys 281-Cys 288) and a region recognized by anticardiolipin antibodies. J Immunol. 1994;152:653–9. - PubMed

MeSH terms