Comparative Study
. 2003 May 8:2:12.
doi: 10.1186/1475-925x-2-12.

Finite element analysis of hepatic radiofrequency ablation probes using temperature-dependent electrical conductivity

Affiliations
Comparative Study

Finite element analysis of hepatic radiofrequency ablation probes using temperature-dependent electrical conductivity

Isaac Chang. Biomed Eng Online. .

Abstract

Background: Few finite element models (FEM) have been developed to describe the electric field, specific absorption rate (SAR), and the temperature distribution surrounding hepatic radiofrequency ablation probes. To date, a coupled finite element model that accounts for the temperature-dependent electrical conductivity changes has not been developed for ablation type devices. While it is widely acknowledged that accounting for temperature dependent phenomena may affect the outcome of these models, the effect has not been assessed.

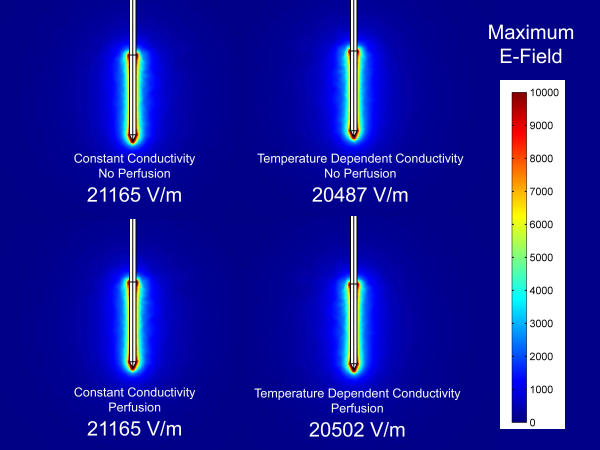
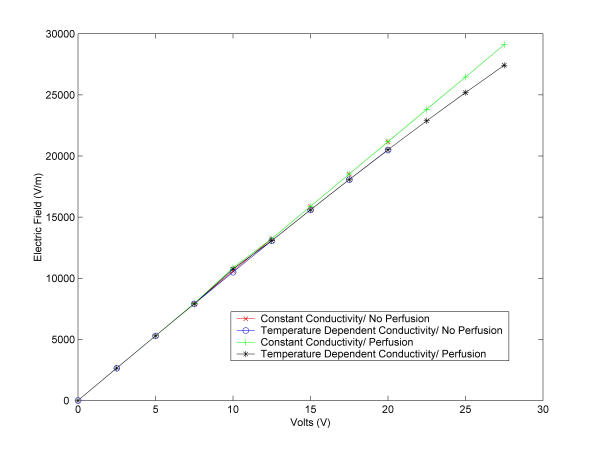
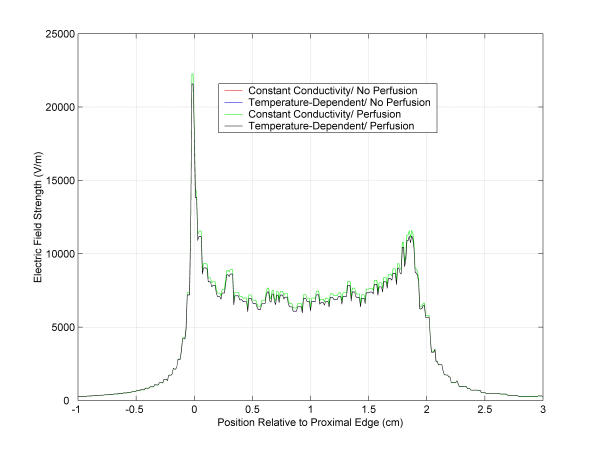
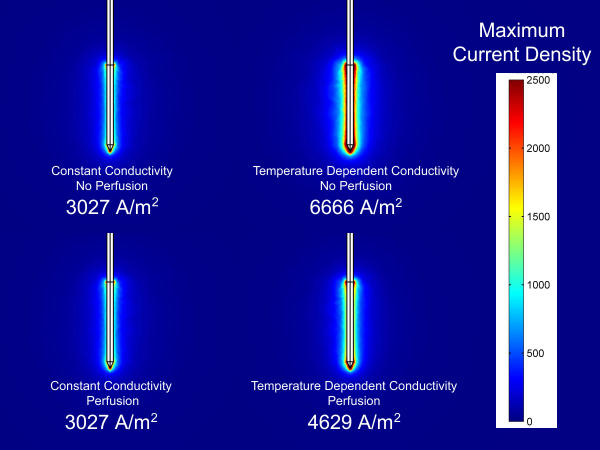
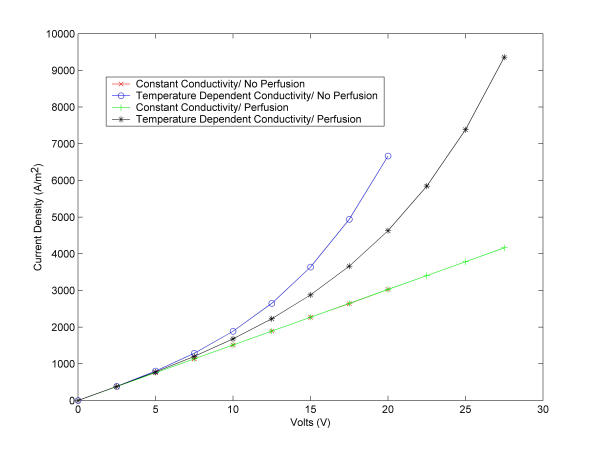
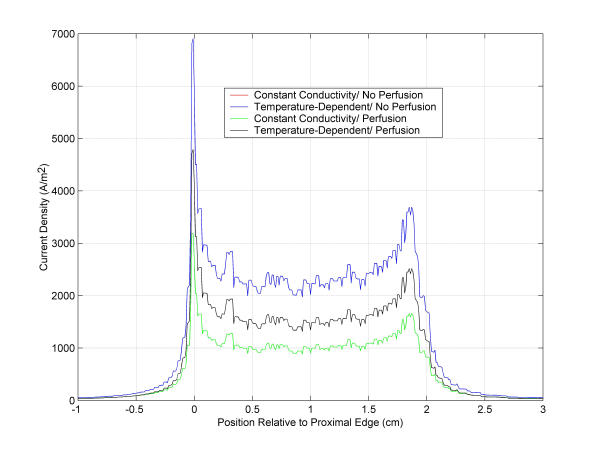
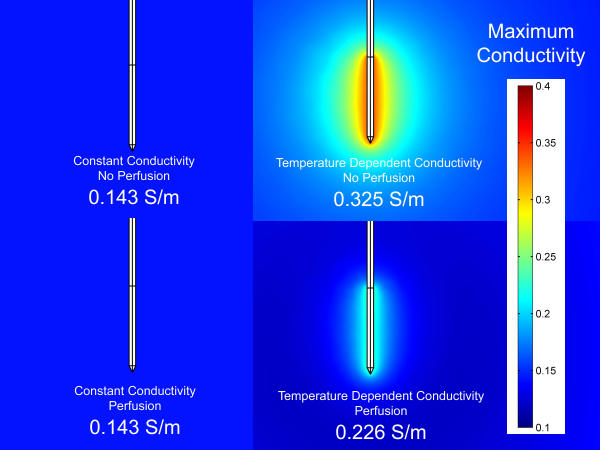
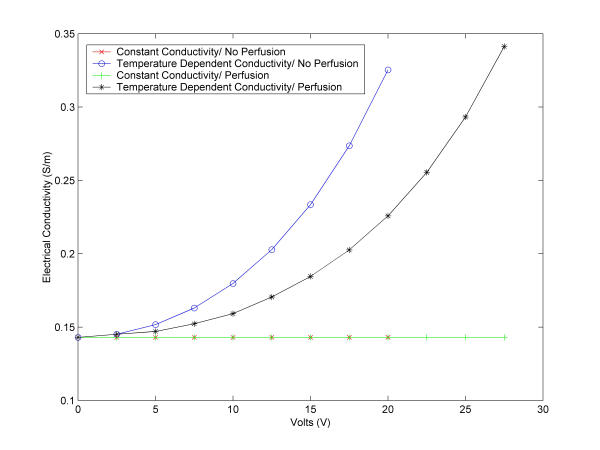
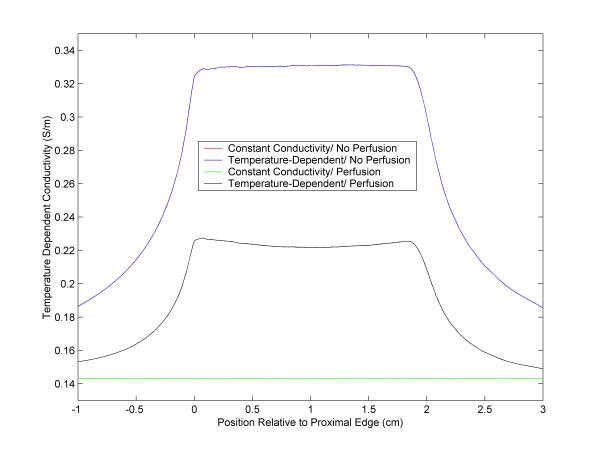
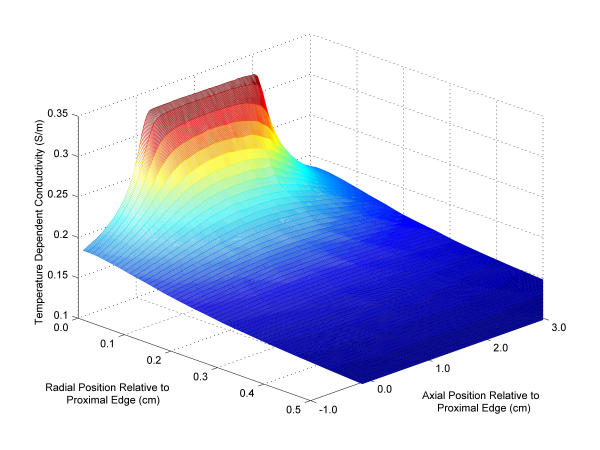
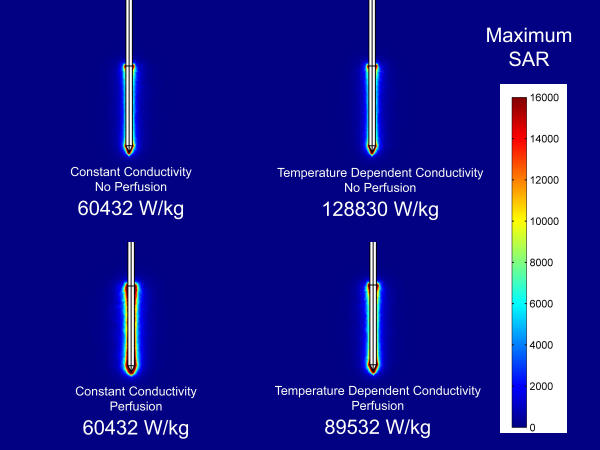
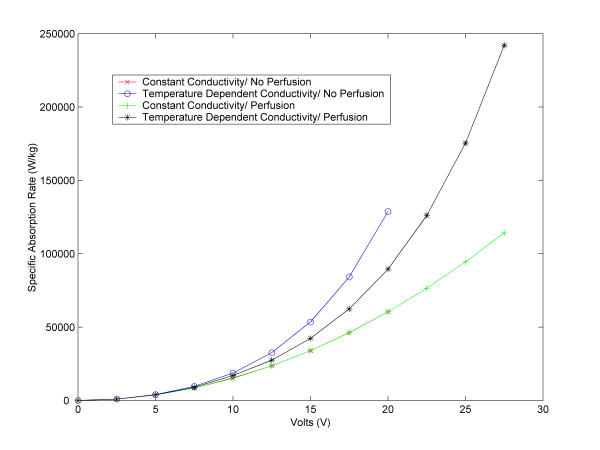
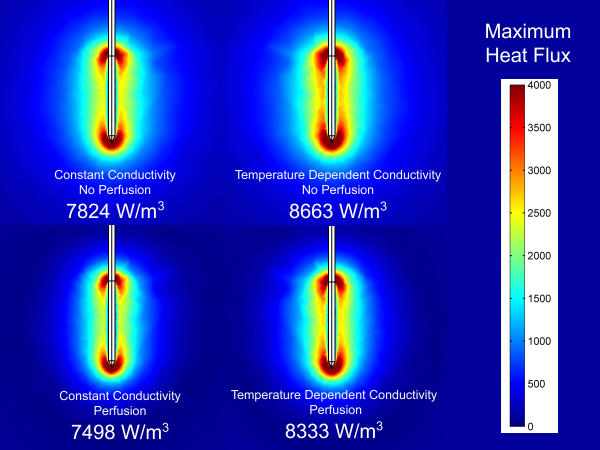
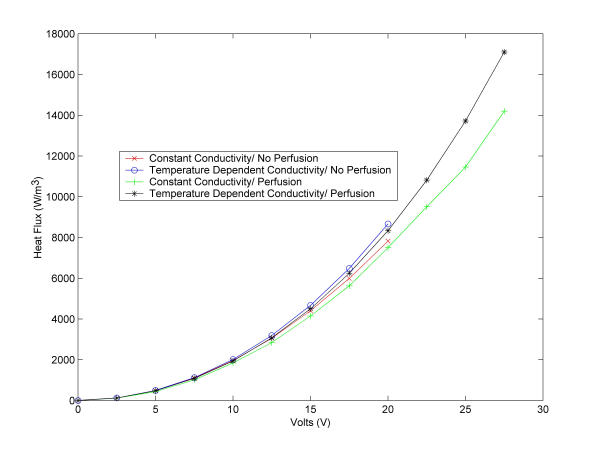
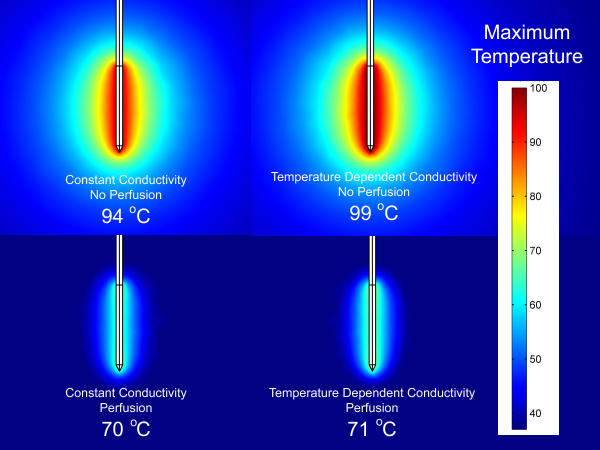
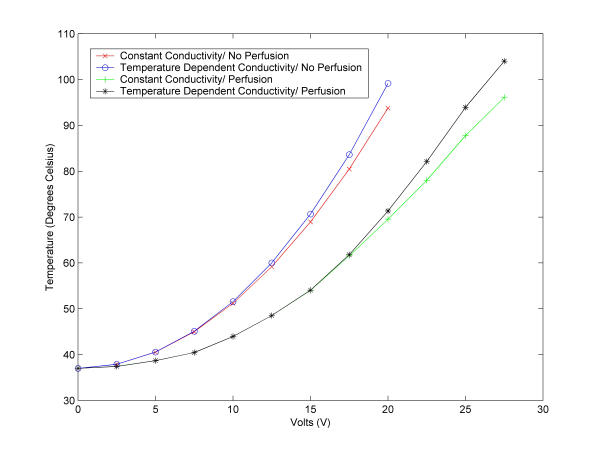
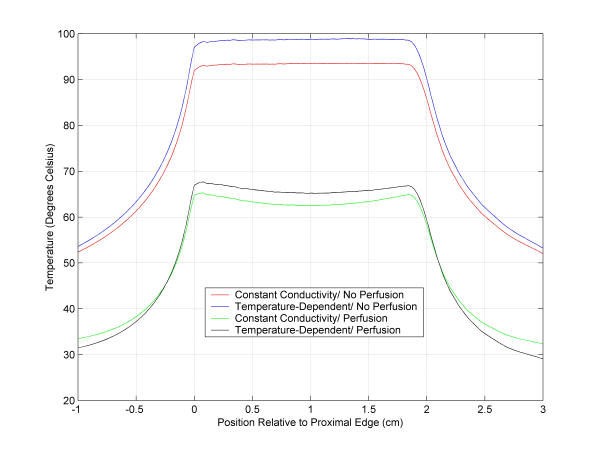
Methods: The results of four finite element models are compared: constant electrical conductivity without tissue perfusion, temperature-dependent conductivity without tissue perfusion, constant electrical conductivity with tissue perfusion, and temperature-dependent conductivity with tissue perfusion.

Results: The data demonstrate that significant errors are generated when constant electrical conductivity is assumed in coupled electrical-heat transfer problems that operate at high temperatures. These errors appear to be closely related to the temperature at which the ablation device operates and not to the amount of power applied by the device or the state of tissue perfusion.

Conclusion: Accounting for temperature-dependent phenomena may be critically important in the safe operation of radiofrequency ablation device that operate near 100 degrees C.


Figures

Figure 1
Figure 1
Ablation Probe Geometry. Diagram of a single needle ablation electrode that is used for hepatic tumor ablation. Therapeutic treatment is achieved by applying a source voltage to the conducting tip. A conducting pad applied to the patient skin serves as an electrical ground return.
Figure 2
Figure 2
Model Geometry. The center of the finite element geometry is the tip of the ablation probe. Source voltage is applied at the electrically conducting tip. External surfaces of the cubic model serve as the electrical ground and are at body temperatures (37°C). The entire ablation probe is assumed to be thermally insulating.
Figure 3
Figure 3
Electric Field Strength Results of FEM models. Comparison of electric field strength distribution for four finite element models when a source voltage of 20.0 volts is applied. Numbers represent the maximum electric field strength in units of Volts/meter.
Figure 4
Figure 4
Electric Field Strength as a Function of Source Voltage. For constant electrical conductivity simulations with (green) and without (red) tissue perfusion the maximum electric field is a linear function of the source voltage. Models that use temperature-dependent conductivity are slightly nonlinear.
Figure 5
Figure 5
Electric Field Strength Distribution. Plot of the electric field strength along the active portion of the radiofrequency ablation probe when a source voltage of 20.0 volts is applied. The highest electric field strength corresponds to the proximal edge. Note: Constant conductivity with (green) and without (red) tissue perfusion overlap, as do temperature- dependent with (black) and without (blue) tissue perfusion.
Figure 6
Figure 6
Current Density Results of FEM Models. Comparison of current density distribution for four finite element models when a source voltage of 20.0 volts is applied. Numbers represent the maximum current density in units of Amps/meter.
Figure 7
Figure 7
Current Density as a Function of Source Voltage. For constant electrical conductivity, simulations with(green) and without (red) tissue perfusion, the maximum current density is a linear function of the source voltage. The figure shows that all cases where tissue perfusion is accounted for fall between the model results for temperature-dependent and constant electrical conductivity with no perfusion.
Figure 8
Figure 8
Current Density Distribution. Plot of the current density along the active portion of the radiofrequency ablation probe when a source voltage of 20.0 volts is applied. The highest current density corresponds to the proximal edge. The figure shows that in all cases where perfusion is accounted for fall between the model results for temperature-dependent and constant electrical conductivity with no perfusion. Note: Constant conductivity with (green) and without (red) tissue perfusion overlap.
Figure 9
Figure 9
Electrical Conductivity change Results of FEM models Comparison of electrical conductivity distribution for four finite element models when a source voltage of 20.0 volts is applied. Numbers represent the maximum electrical conductivity in units of Siemens/meter.
Figure 10
Figure 10
Electrical Conductivity as a Function of Source Voltage Figure demonstrates that larger sources are necessary to achieve the same electrical conductivity change in cases where tissue perfusion are accounted for.
Figure 11
Figure 11
Electrical Conductivity Distribution Plot of the electrical conductivity along the active portion of the radiofrequency ablation probe when a source voltage of 20.0 volts is applied. When tissue perfusion is neglected, the largest changes in electrical conductivity occur in the center of the ablation probe. When tissue perfusion is accounted for, the largest changes in electrical conductivity occur at the proximal edge and the distal tip.
Figure 12
Figure 12
Three-Dimensional Electrical Conductivity Distribution Figure represents the distribution of temperature-dependent electrical conductivity along the active portion of the radiofrequency ablation probe when a source voltage of 20.0 volts is applied. The electrical conductivity decreases rapidly with distance in the radial direction.
Figure 13
Figure 13
SAR results of FEM Models Comparison of the specific absorption rate for four finite element models when a source voltage of 20.0 volts is applied. Numbers represent the maximum SAR in units of Watts/kilogram.
Figure 14
Figure 14
SAR as a Function of Source Voltage For constant electrical conductivity simulations with (green) and without (red) tissue perfusion, the maximum specific absorption rate plots overlap. The figure shows that all cases where tissue perfusion is accounted for will fall between the model results for temperature-dependent and constant electrical conductivity with no tissue perfusion.
Figure 15
Figure 15
Heat Flux Results of FEM Models Comparison of heat flux distributions for four finite element models when a source voltage of 20.0 volts is applied. Numbers represent the maximum heat flux in units of Watts/meter3.
Figure 16
Figure 16
Heat Flux as a Function of Source Voltage The figure demonstrates that both temperature-dependant phenomena and tissue perfusion affect the heat flux.
Figure 17
Figure 17
Temperature Results of FEM Models Comparison of computed temperature distributions for four finite element models when a source voltage of 20.0 volts is applied. Numbers represent the maximum temperature achieved in units of degrees Celsius.
Figure 18
Figure 18
Temperature as a Function of Source Voltage The figure demonstrates that the difference between calculated temperatures using constant and temperature-dependent electrical properties is dependent on the absolute temperatures at which radiofrequency ablation probes operate, and not a function of perfusion.
Figure 19
Figure 19
Temperature Distribution Plot of the temperature distribution along the active portion of the radiofrequency ablation probe when a source voltage of 20.0 volts is applied. When tissue perfusion is neglected, the highest temperatures occur in the center of the ablation probe. When tissue perfusion is accounted for, the highest temperatures occur at the proximal edge and the distal tip.

References

    1. Mizra A, Fornage B, Sneige N, Kuerer H, Newman L, Ames F, Singletary S. Radiofrequency ablation of solid tumors. Cancer J. 2001;7:95–102. - PubMed
    1. Goldberg S. Radiofrequency tumor ablation: principles and techniques. Eur J Ultrasound. 2001;13:129–47. doi: 10.1016/S0929-8266(01)00126-4. - DOI - PubMed
    1. Schwartzman D, Chang I, Michele JJ, Mirotznik M, Foster KR. Electrical Impedance Properties of Normal and Chronically Infarcted Left Ventricular Myocardium. J Interventional Cardiac Electrophysiology. 1999;3:213–224. doi: 10.1023/A:1009887306055. - DOI - PubMed
    1. Petersen HH, Chen X, Pietersen A, Svendsen JH, Haunso S. Lesion dimensions during temperature-controlled radiofrequency catheter ablation of left ventricular porcine myocardium: Impact of ablation site, electrode size, and convective cooling. Circulation. 1999;99:319–325. - PubMed
    1. Zhang JZ, Tsai H, Cao Y, Chen JA, Will V, Vorperian VR, Webster JG. Noncontact radio-frequency ablation for obtaining deeper lesions. IEEE Trans Biomed Eng. 2003;50:218–223. doi: 10.1109/TBME.2002.807647. - DOI - PubMed

Publication types

LinkOut - more resources