. 2003 Jun 2;197(11):1525-35.
doi: 10.1084/jem.20020234.

Protein kinase C theta affects Ca2+ mobilization and NFAT cell activation in primary mouse T cells

Affiliations

Protein kinase C theta affects Ca2+ mobilization and NFAT cell activation in primary mouse T cells

Christa Pfeifhofer et al. J Exp Med. .

Erratum in

  • J Exp Med. 2003 Jul 7;198(1):183

Abstract

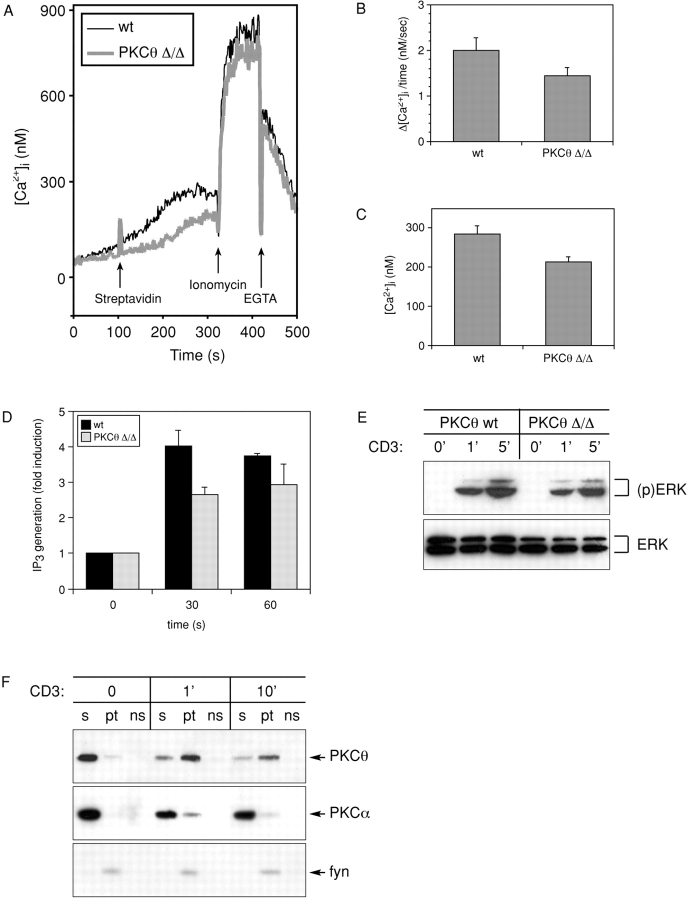
Protein kinase C (PKC)theta is an established component of the immunological synapse and has been implicated in the control of AP-1 and NF-kappaB. To study the physiological function of PKCtheta, we used gene targeting to generate a PKCtheta null allele in mice. Consistently, interleukin 2 production and T cell proliferative responses were strongly reduced in PKCtheta-deficient T cells. Surprisingly, however, we demonstrate that after CD3/CD28 engagement, deficiency of PKCtheta primarily abrogates NFAT transactivation. In contrast, NF-kappaB activation was only partially reduced. This NFAT transactivation defect appears to be secondary to reduced inositol 1,4,5-trisphosphate generation and intracellular Ca2+ mobilization. Our finding suggests that PKCtheta plays a critical and nonredundant role in T cell receptor-induced NFAT activation.


Figures

Figure 1.
Figure 1.
Targeted disruption of the PKCθ locus. (A) Schematic representation of the murine wild-type PKCθ locus (top) showing NH2-terminal exons (1–5, open arrows) and the PKCθ conditional knockout allele (flox). Due to targeting vector design, Cre-mediated recombination deletes the complete coding sequence of exons 3 and 4, inducing a frame shift mutation between exons 2 and 5, resulting in an only 9 amino acid residual open reading frame of the mutated PKCθΔ locus. The position of the 3′ flanking probe as well as PCR primers E5.2-Cre, E5.2-S, and E10.5-3, which were used for genotyping, are indicated. (B) Genomic DNA was digested with BglII and hybridized to the 3′ flanking probe. Wild-type and mutantΔ bands are indicated. (C) PCR genotyping using primer pairs E5.2-S/E10.5-3 (to detect a 2 kb mutantΔ allele-derived product) and E5.2-S/E5.2-CRE (to detect a 1.2-kb wild-type+ allele-derived product). (D and E) Western blot analysis of 5 × 10⁶/lane thymocytes (D) and mature purified CD3+ T cells (E). Antibodies were directed against PKCθ (using distinct epitopes in N or C terminus, respectively), PKCα, δ, ɛ, ζ/ι, and p59fyn, with the latter as loading control, as indicated.
Figure 2.
Figure 2.
Impaired T cell activation in PKCθD/D mice. Proliferative responses of purified mature CD3+ T cells of wild-type (wt), PKCθΔ/+, and PKCθΔ/Δ. After incubation with medium alone and (A) various stimuli such as anti-CD3 (96-well plates were precoated with a concentration of 10 μg ml−1), with or without 1 μg ml−1 soluble anti-CD28, 40 units ml−1 human, recombinant IL-2, or (B) 10 ng ml−1 PDBu and ionomycin (at a range from 50 to 500 ng ml−1, as indicated) for 48 h, cultures were pulsed for 16 h with 1 μCi [3H]thymidine per well and cells were then harvested and analyzed using standard procedures. Results shown are the mean ± SD [3H]thymidine incorporation of at least five independent experiments.
Figure 3.
Figure 3.
Impaired IL-2 secretion in PKCθD/D mice. IL-2 cytokine secretion responses of (A) purified mature CD3+ T cells of wild-type+/+, PKCθΔ/+, and PKCθΔ/Δ. IL-2 concentration in the supernatants of culture treated with various stimuli: medium, anti-CD3 (precoated with a concentration of 10 μg ml−1), 1 μg ml−1 soluble anti-CD28, 10 ng ml−1 PDBu, and 1 μg ml−1 ionomycin, as indicated. IL-2 produced from the cultures was measured by quantifying the proliferation of the IL-2–dependent indicator cell line CTLL-2. Cells were then harvested and analyzed using standard procedures. (B) For the mixed lymphocyte reaction assays, purified mature CD3+ T cells of wild-type+/+ and PKCθΔ/Δ littermates were mixed in duplicates at various densities with mitomycin C–treated splenocytes from BALB/c mice, as indicated. After 48 h of growth, the cells were pulsed for 16 h with 1 μCi [3H]thymidine. Results shown are the mean ± SD [3H]thymidine incorporation of at least four independent experiments.
Figure 4.
Figure 4.
Flow cytometric analysis of expression of CD25, CD44, and CD69 on PKCθD/D T cells. Single cell suspensions of purified mature CD3+ T cells stimulated or not for 16 h with anti-CD3 and anti-CD28, were stained with anti-CD25, anti-CD44, and anti-CD69. Percentages of positive cells are indicated. Experiments were repeated at least three times in duplicates with similar results.
Figure 5.
Figure 5.
EMSA analysis of NF-κB, AP-1, and NFAT in PKCθD/D T cells. Nuclear extracts were prepared from purified mature CD3+ wild-type and PKCθD/D T cells stimulated for 16 h with medium alone or plate-bound anti-CD3 plus soluble anti-CD28 as indicated. Gel mobility shift assays were performed using radiolabeled probes containing either (A) NF-κB, (B) AP-1, and (C and D) NFAT-binding site sequences. (D) To study the time course of NFAT activation, CD3+ T cells were stimulated for 4, 8, and 16 h with anti-CD3 plus anti-CD28 or medium alone as indicated. The specificity of p50 NF-κB as well as NFATc and NFATp was confirmed by supershifting the electrophoretic mobility shift with antibodies as indicated by the arrow. Experiments were repeated at least three times with similar results.
Figure 6.
Figure 6.
Protein expression analysis of p50, cfos, cjun, and NFAT in PKCθD/D T cells. To control for the normal levels of protein expression of the transcription factors studied in EMSA, whole cell extracts of resting and 16 h–activated T cells were immunostained with the specific antibodies as indicated. Immunostaining of p59fyn served as equal protein loading control.
Figure 7.
Figure 7.
PKCθ is required for normal TCR-driven calcium mobilization but not for ERK activation. (A) Purified mature CD3+ T cells (purified from pooled spleen and lymph nodes) were loaded with Fura-2 and monitored for changes in intracellular-free calcium [Ca2+]i. CD3 cross-linking was induced by streptavidin and direct Ca2+ influx with ionomycin. (B and C) Ca2+ signaling patterns from four representative experiments performed in duplicates are statistically analyzed. Slope (B, nM/s) and plateau (C, nM) of intracellular Ca2+ varied significantly in PKCθ-deficient cells (P < 0.01). (D) Graphs showing the mean levels of IP3 stimulated by cross-linking of CD3 as above for 0, 30, and 60 s. Detected IP3 levels ranged from 0.2 pmol/107 cells (unstimulated cells) to 0.8 pmol/107 cells (wild-type stimulated cells). Results shown are the mean ± SD of at least three independent experiments. (E) Total cell lysates were immunostained sequentially with anti–phospho-MAPK that detects dually phosphorylated (active) ERK1, ERK2, and anti-ERK1/2 that recognizes pan-ERK. (F) Kinetics of subcellular translocation of endogenous PKC isotypes in Jurkat T cells as indicated. The cell fractions are defined as the soluble (s, cytosol) fraction, the particulate (pt, predominantly plasma membrane) fraction, and the NP-40 nonsoluble fraction (ns, predominantly cytoskeleton, detergents insoluble membrane domains). As internal control for cell fractionation, immunostaining of p59fyn predominantly recognized the particulate fraction.

References

    1. Baier, G. 2003. The PKC gene module: molecular biosystematics to resolve its T cell functions. Immunol. Rev. 192:64–79. - PubMed
    1. Baier, G., D. Telford, L. Giampa, K.M. Coggeshall, G. Baier-Bitterlich, N. Isakov, and A. Altman. 1993. Molecular cloning and characterization of PKCθ, a novel member of the protein kinase C (PKC) gene family expressed predominantly in hematopoietic cells. J. Biol. Chem. 268:4997–5004. - PubMed
    1. Baier, G., G. Baier-Bitterlich, N. Meller, K.M. Coggeshall, L. Giampa, D. Telford, N. Isakov, and A. Altman. 1994. Expression and biochemical characterization of human PKCθ. Eur. J. Biochem. 225:195–203. - PubMed
    1. Wilda, M., N. Ghaffari-Tabrizi, I. Reisert, G. Utermann, G. Baier, and H. Hameister. 2001. Protein kinase C isoenzyme: selective expression pattern of PKCθ; during mouse development. Mech. Dev. 103:197–200. - PubMed
    1. Baier-Bitterlich, G., F. Uberall, B. Bauer, F. Fresser, H. Wachter, H. Grunicke, G. Utermann, A. Altman, and G. Baier. 1996. PKCθ isoenzyme selective stimulation of the transcription factor complex AP-1 in T lymphocytes. Mol. Cell. Biol. 16:1842–1850. - PMC - PubMed

Publication types

MeSH terms