

Regions of allelic imbalance in the distal portion of chromosome 12q in gastric cancer
- PMID: 12782760
- PMCID: PMC1187309
- DOI: 10.1136/mp.56.3.141
Regions of allelic imbalance in the distal portion of chromosome 12q in gastric cancer
Abstract
Aims: To define regions of loss on the distal portion of chromosome 12q in gastric adenocarcinoma.
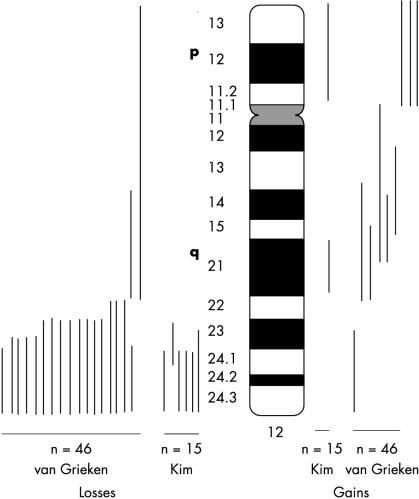
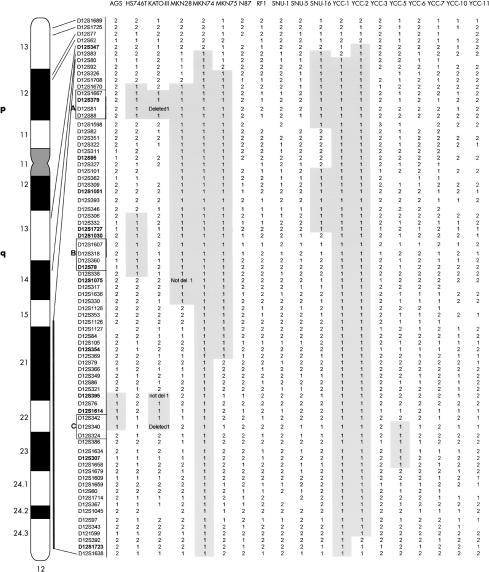
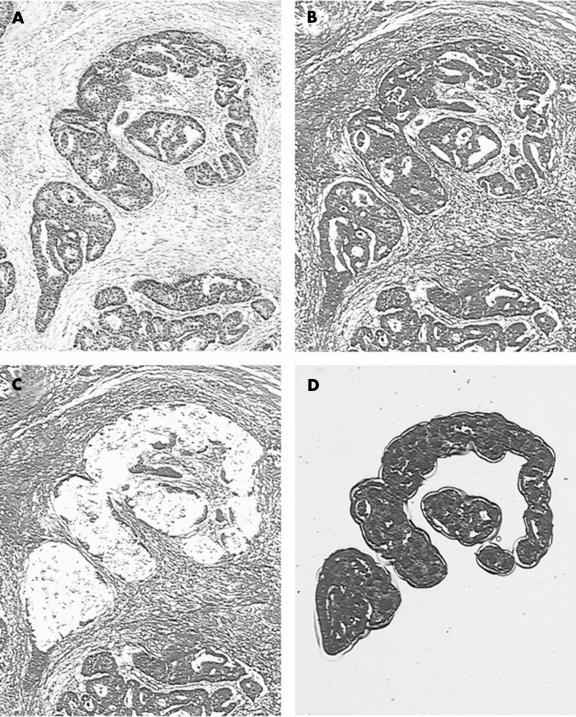
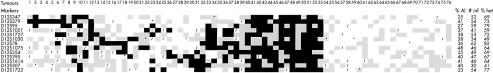
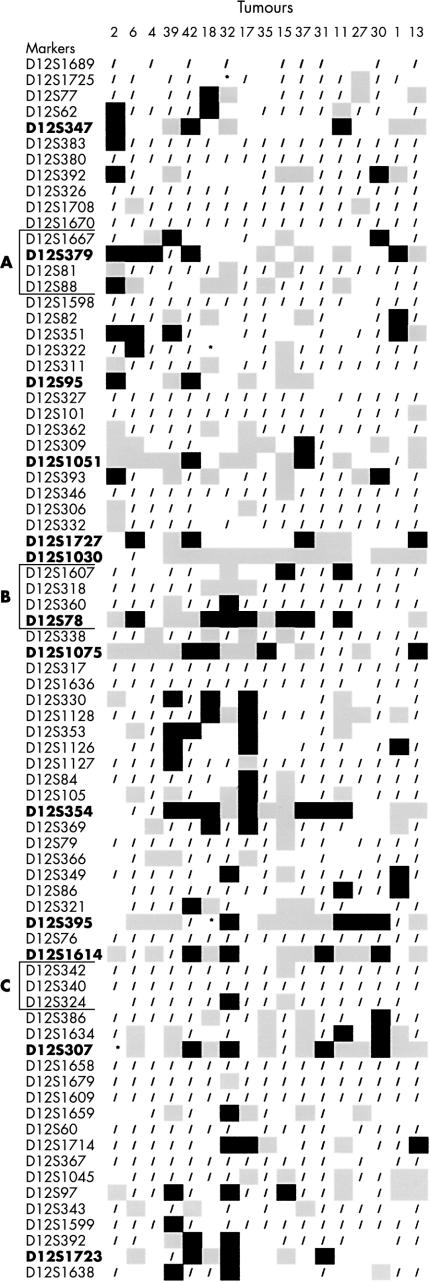
Methods: Microsatellite analysis on chromosome 12 was performed on 19 human gastric cancer cell lines using 77 markers, 71 of which were within or distal to 12q21; some portions of this region showed extended regions of homozygosity (ERHs) in 10 of 19 gastric cancer cell lines. In addition, microdissected tumour cells from 76 primary gastric adenocarcinomas were examined using 13 markers of interest implicated by the cell line data; 70% of these showed allelic imbalance (AI) at one or more markers in or distal to 12q21.
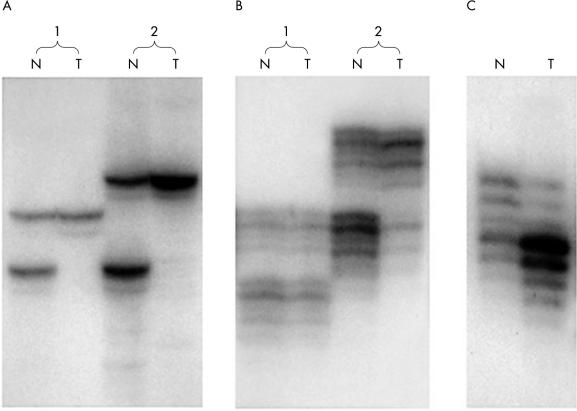
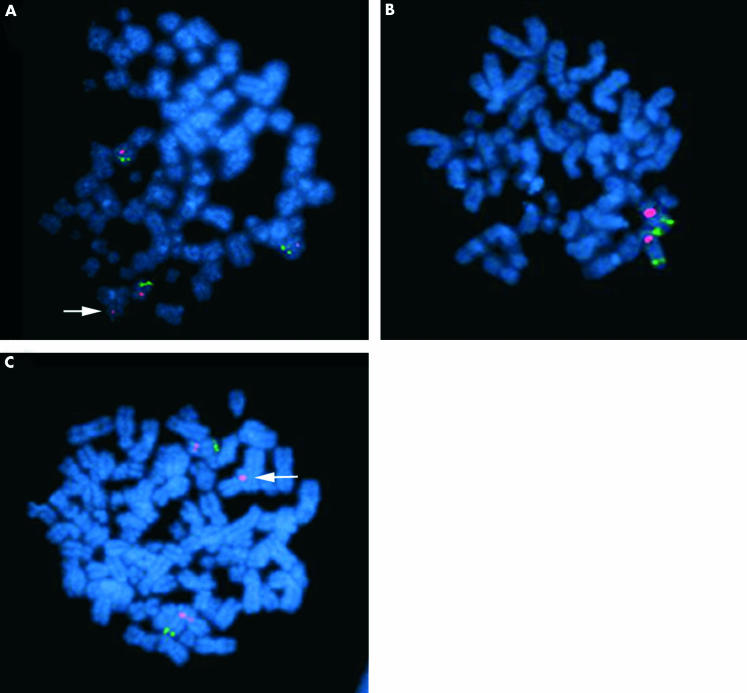
Results: Mapping ERHs in the cell lines and sites of AI in the tumours identified three regions that contain putative tumour suppressor genes: region A is located within 2.8 Mb between markers D12S1667 and D12S88; region B, within 1.9 Mb between markers D12S1607 and D12S78; and region C, in 0.74 Mb between markers D12S342 and D12S324. Fluorescence in situ hybridisation (FISH) analysis in two cell lines confirmed that two of the ERHs reflected deletions, not amplifications, of D12S81 in region A and D12S340 in region C. FISH analysis of marker D12S1075 within an ERH containing region B in one cell line showed neither amplification nor deletion. AI on 12q was not associated with prognosis, but was associated with ethnicity of the patient.
Conclusions: These results identify regions on chromosome 12 that appear to contain tumour suppressor genes important in the development of gastric cancer.
Figures
Similar articles
-
Identification of two common regions of allelic loss in chromosome arm 12q in human pancreatic cancer.Cancer Res. 1998 Jun 1;58(11):2456-60. Cancer Res. 1998. PMID: 9622089
-
Allelic imbalance in gastric cancer: an affected site on chromosome arm 3p.Genes Chromosomes Cancer. 1995 Aug;13(4):263-71. doi: 10.1002/gcc.2870130406. Genes Chromosomes Cancer. 1995. PMID: 7547634
-
Allelotype analysis of adenocarcinoma of the gastric cardia.Br J Cancer. 1997;76(11):1455-65. doi: 10.1038/bjc.1997.578. Br J Cancer. 1997. PMID: 9400942 Free PMC article.
-
Deletion mapping on chromosome 1p in well-differentiated gastric cancer.Br J Cancer. 1996 Feb;73(4):424-8. doi: 10.1038/bjc.1996.76. Br J Cancer. 1996. PMID: 8595154 Free PMC article.
-
Allelic loss of chromosome 6q in gastric carcinoma.Diagn Mol Pathol. 2003 Dec;12(4):193-200. doi: 10.1097/00019606-200312000-00003. Diagn Mol Pathol. 2003. PMID: 14639105
Cited by
-
Cancer-selective apoptotic effects of extracellular and intracellular Par-4.Oncogene. 2010 Jul 8;29(27):3873-80. doi: 10.1038/onc.2010.141. Epub 2010 May 3. Oncogene. 2010. PMID: 20440265 Free PMC article. Review.
-
Biology of SNU cell lines.Cancer Res Treat. 2005 Feb;37(1):1-19. doi: 10.4143/crt.2005.37.1.1. Epub 2005 Feb 28. Cancer Res Treat. 2005. PMID: 19956504 Free PMC article.
-
Phosphorylation of Par-4 by protein kinase A is critical for apoptosis.Mol Cell Biol. 2005 Feb;25(3):1146-61. doi: 10.1128/MCB.25.3.1146-1161.2005. Mol Cell Biol. 2005. PMID: 15657440 Free PMC article.
-
Genome-wide Profiling Identifies DNA Methylation Signatures of Aging in Rod Photoreceptors Associated with Alterations in Energy Metabolism.Cell Rep. 2020 Apr 21;31(3):107525. doi: 10.1016/j.celrep.2020.107525. Cell Rep. 2020. PMID: 32320661 Free PMC article.
-
Loss of heterozygosity occurs predominantly, but not exclusively, in the epithelial compartment of pleomorphic adenoma.Neoplasia. 2005 Jul;7(7):688-95. doi: 10.1593/neo.05163. Neoplasia. 2005. PMID: 16026648 Free PMC article.
References
-
- Tahara E. Molecular mechanism of human stomach carcinogenesis implicated in Helicobacter pylori infection. Exp Toxicol Pathol 1998;50:375–8. - PubMed
-
- Schneider BG, Pulitzer DR, Brown RD, et al. Allelic imbalance in gastric cancer: an affected site on chromosome arm 3p. Genes Chromosomes Cancer 1995;13:263–71. - PubMed
-
- Sano T, Tsujino T, Yoshida K, et al. Frequent loss of heterozygosity on chromosomes 1q, 5q, and 17p in human gastric carcinomas. Cancer Res 1991;51:2926–31. - PubMed
-
- Schmutte C, Baffa R, Versonese LM, et al. Human thymine-DNA glycosylase maps at chromosome 12q22–q24.1: a region of high loss of heterozygosity in gastric cancer. Cancer Res 1997;57:3010–15. - PubMed
Publication types
MeSH terms
Substances
Grants and funding
LinkOut - more resources
Full Text Sources
Other Literature Sources
Medical
Miscellaneous