. 2003 Aug 29;278(35):33501-18.
doi: 10.1074/jbc.M303591200. Epub 2003 Jun 4.

Mice lacking phosphatidylinositol transfer protein-alpha exhibit spinocerebellar degeneration, intestinal and hepatic steatosis, and hypoglycemia

Affiliations

Mice lacking phosphatidylinositol transfer protein-alpha exhibit spinocerebellar degeneration, intestinal and hepatic steatosis, and hypoglycemia

James G Alb Jr et al. J Biol Chem. .

Abstract

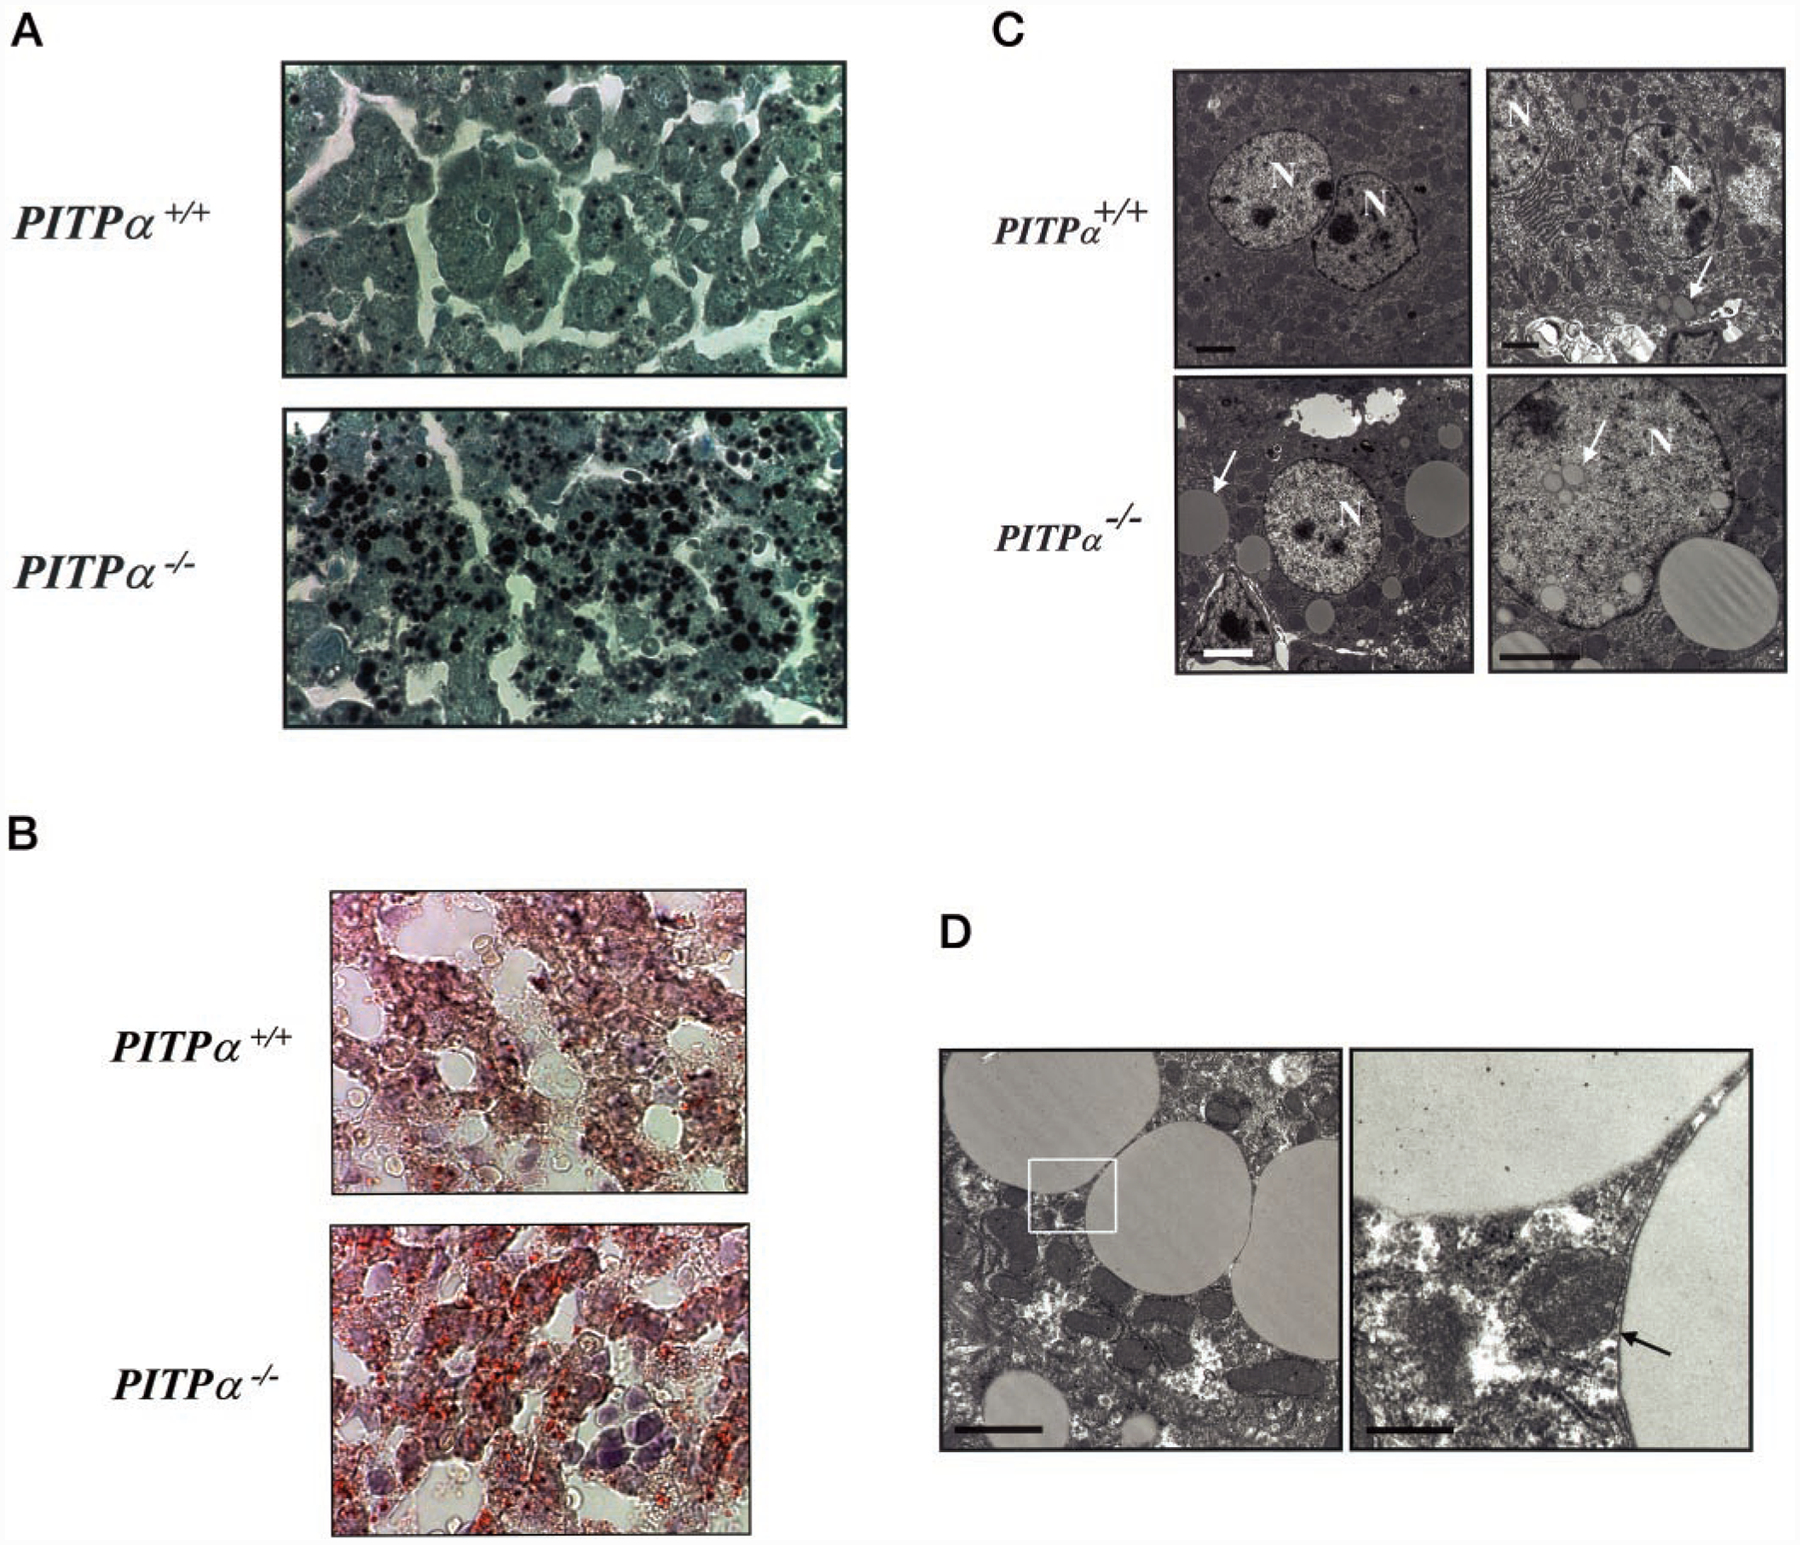
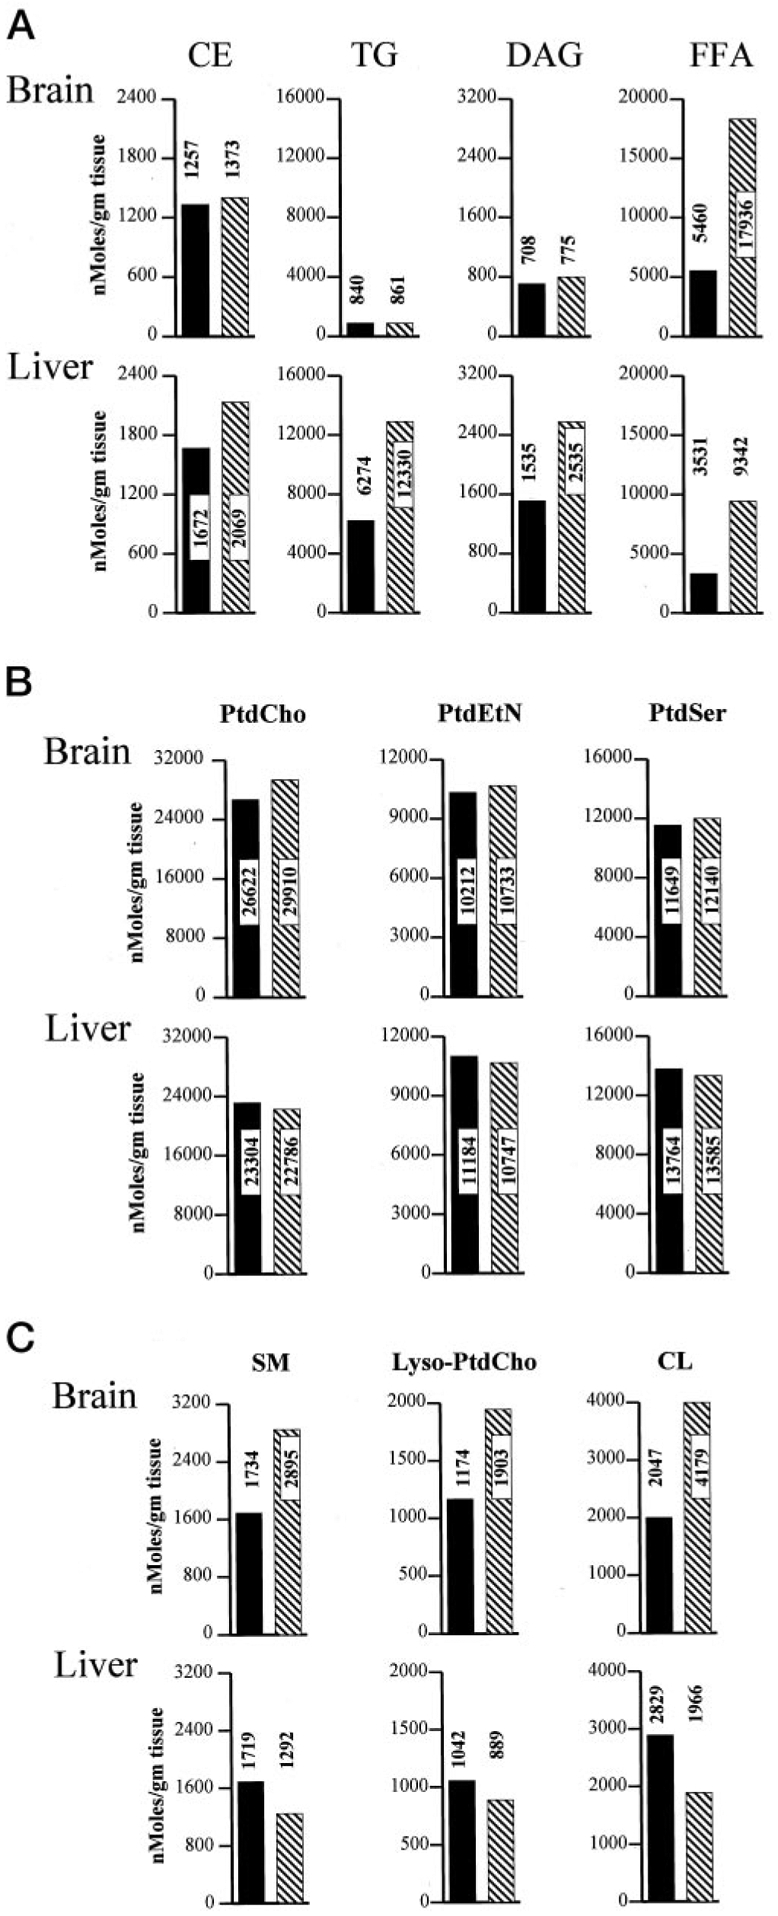
Phosphatidylinositol transfer proteins (PITPs) regulate the interface between lipid metabolism and cellular functions. We now report that ablation of PITP alpha function leads to aponecrotic spinocerebellar disease, hypoglycemia, and intestinal and hepatic steatosis in mice. The data indicate that hypoglycemia is in part associated with reduced proglucagon gene expression and glycogenolysis that result from pancreatic islet cell defects. The intestinal and hepatic steatosis results from the intracellular accumulation of neutral lipid and free fatty acid mass in these organs and suggests defective trafficking of triglycerides and diacylglycerols from the endoplasmic reticulum. We propose that deranged intestinal and hepatic lipid metabolism and defective proglucagon gene expression contribute to hypoglycemia in PITP alpha-/- mice, and that hypoglycemia is a significant contributing factor in the onset of spinocerebellar disease. Taken together, the data suggest an unanticipated role for PITP alpha in with glucose homeostasis and in mammalian endoplasmic reticulum functions that interface with transport of specific luminal lipid cargoes.


Figures

Fig. 1.
Fig. 1.. Generation and characterization of PITPα-deficient mice.
A, targeted replacement of the wild-type PITPα locus with PITPαΔ::neo*. Organization of the targeting vector is shown. Probe 1 represents a 500-bp DNA fragment that resides outside the bounds of the targeting vector and is employed for diagnosis of targeting events. Exons 7–10 of the PITPα structural gene are indicated as closed bars and are numbered accordingly. Restriction enzyme sites: E, EcoRI; X, XbaI; K, KpnI; S, SacI. B, OmniBank gene trap library at the PITPα locus. Retroviral construct VICTR20 is depicted (20). The PITPα::neo/puro mutation represents integration of VICTR20 between PITPα exons 7 and 8 and truncates PITPα after residue 162. The abbreviations used are as follows: LTR, long terminal repeat; PGK, phosphoglycerate kinase-1 promoter; puro, puromycin N-acetyltransferase gene; SD, spice donor sequence; SA, splice acceptor sequence; IRES, internal ribosome entry site; geo, galactosidase/neomycin phosphotransferase fusion gene; pA, polyadenylation sequence. C, distribution of PITPα genotypes in the F1. The number of live births obtained for each PITPα genotype (indicated at top), from a dedicated set of 408 F1 progeny of PITPα−/+ intercrosses, is given above the corresponding bar. D, confirmation of viable PITPα−/− progeny. Upper left panel, diagnostic PCR profiles of PITPα+/+, PITPα−/+, and PITPα−/− progeny derived from a PITPα+/− intercross. Upper right panel, total brain lysates (20 μg) harvested from each of five sibling pups (genotypes indicated) derived from a PITPα+/− intercross were resolved by SDS-PAGE and developed by immunoblotting with PITPα-specific antibodies. Lower panel, immunoblot of PITPβ in brain lysates (20 μg) from neonates of indicated genotype.
Fig. 2.
Fig. 2.. Overt phenotypes of PITPα−/− mice.
A, mortality profile derived from a pool of 57 PITPα−/− mice generated from 5 mating pairs over a period of 5 mating cycles. Data are presented as percentage of surviving progeny (+/+, open circles; −/−, closed circles) as a function of time (postnatal day). B, rates of body mass increase of PITPα+/+ and PITPα−/− littermates. Values represent averages for two sibling mice of each genotype (+/+, open circles; −/−, closed circles). The data are representative. C, visual comparison of PITPα+/+ and PITPα−/− littermates. Genotypes are at bottom. D, stomachs (S) of age-matched PITPα+/+ and PITPα−/− mice (P7) are filled with milk. Subcutaneous axillary (AF) and inguinal (IF) fat pads are indicated. E, comprehensive chemical analysis of eviscerated carcasses. Measurements represent the averages from six P6 and three P8 PITPα+/+ animals (solid bars) and six P6 and three P8 PITPα−/− mice (hatched bars). The abbreviations used are as follows: total, eviscerated carcass mass; FFDM, fat-free dry mass; and ASH, non-combustible carcass bone ash.
Fig. 3.
Fig. 3.. Cerebellar injury in PITPα-deficient mice.
A, TUNEL staining of cerebellum. Genotypes are indicated. The ApopTag Fluorescein in Situ Detection Kit (Intergen Co.) was used as instructed by the manufacturer. B, Purkinje cell defects in PITPα−/− cerebellum. The Purkinje cell layer was revealed by staining with calbindin antibodies and counterstaining with toluidine blue O. C, reactive gliosis in PITPα−/− cerebellum. Sagittal sections of PITPα+/+ and PITPα−/− cerebellum (as indicated) were stained with anti-GFAP antibodies with or without counterstaining with toluidine blue O (right and left columns, respectively). D, higher magnification images of PITPα+/+ and PITPα−/− cerebellum stained with anti-GFAP antibodies and counterstained with toluidine blue O. Genotypes are at top.
Fig. 4.
Fig. 4.. Neurodegenerative and inflammatory changes in PITPα−/− spinal cord.
A, complete spinal cord sections were generated by reconstructing images from 2-μm-thick, epoxy resin-embedded sections of PITPα+/+ stained with toluidine blue O (left, number of images n = 30) and PITPα−/− spinal cord (right, n = 22). Bars are 0.15 mm. B, images from the ventral interface between gray and white matter (GM/WM interface) of cervical spinal cord sections. Top panels, representative images of PITPα+/+ motor neuron cell bodies (left, open arrows) and abnormally dark staining PITPα−/− motor neuron cell bodies (right, dark arrows) are indicated. Bars are as follows: left, 50 μm; right, 100 μm. WM regions are indicated. Bottom panels, additional images from GM/WM interface of PITPα−/− cervical spinal cord are shown. Characteristic neurodegenerative symptoms include highly vacuolated cells (center panel, solid arrow), dark cells (right panel, solid arrows), and abnormally lightly stained cells without discrete intracellular structure (right panel, *). Bars are as follows: left, 100 μm; center, 50 μm; right, 20 μm. C, inflammatory cells in PITPα−/− thoracic spinal cord. Left panel, mast cell (MC) and capillary lumen (C) are indicated. Right panel, macrophage (MF) and capillary lumen (C) are indicated. Bars are as follows: left, 20 μm; right, 5 μm. D, electron micrographs of myelin from the WM/GM interface of PITPα+/+ (left) and PITPα−/− spinal cord (center). Examples of myelinated axons are indicated by arrows. Right panel, cells that may be remodeling myelin are present in large numbers in PITPα−/− mice and an example is indicated (*). Bars are as follows: left, 15 μm; center, 10 μm; right, 6 μm.
Fig. 5.
Fig. 5.. Accumulation of lipid in PITPα−/− duodenal epithelium.
A, intracellular lipid in enterocytes of PITPα−/− duodenum. Sections (5 μm thick) of duodenum from PITPα+/+ and PITPα−/− P5 siblings were stained with osmium and counterstained with toluidine blue O. Black granules identify lipid. Relevant genotypes are given. B, electron micrographs of duodenal epithelium from PITPα+/+ (left) and PITPα−/− (right) P8 mice are shown. Bars are 5 μm. C, electron micrographs of enterocytes from PITPα+/+ and PITPα−/− mice as indicated. Bars are 2 μm. D, electron micrographs of lipid bodies from PITPα+/+ (left panels) and PITPα−/− enterocytes (right panels) as indicated. Dimensions of the lipid bodies aside, the general morphologies of these structures exhibit many similarities in wild-type versus mutant enterocytes, and most are membrane-enclosed. Boundary membranes are indicated by arrows. A cytoplasmic lipid droplet (L) with a fuzzy border is shown for contrast. Bars are 0.2 μm. E, distribution histogram of vesicle perimeters in PITPα+/+ (solid symbols) and PITPα−/− mice (open symbols). Perimeter measurements were made for 428 and 398 lipid bodies from PITPα+/+ and PITPα−/− enterocytes, respectively. F, enlargement of smooth ER in PITPα−/− duodenal enterocytes as revealed by electron microscopy. Lipid-engorged regions are identified by arrows. These smooth ER luminal regions are contiguous with the lumen of adjacent rough ER that is easily recognized by the associated ribosomes (not shown). Bar is 0.4 μm. G, PITPα−/− mice exhibit reduced brain α-tocopherol and post-prandial TG levels. Parameters are indicated. Measurements were made from nine PITPα+/+ and nine PITPα−/− mice. Averages ± S.D. are given.
Fig. 6.
Fig. 6.. Microvesicular steatosis in PITPα−/− hepatocytes.
A, liver sections from PITPα+/+ and PITPα−/− P5 siblings were stained with osmium and counterstained with toluidine blue O. Black granules identify lipid. Relevant genotypes are given at left. B, liver sections from mice of the indicated genotype were stained with Oil Red O and counterstained with hematoxylin/eosin. The red globules prevalent in sections of PITPα nullizygous liver identify neutral lipid bodies. C, electron micrographs of PITPα+/+ and PITPα−/− liver sections are shown. Nuclei (N) and examples of lipid bodies are highlighted by arrows. Bars (clockwise from upper left) are 2, 2, 3, and 2 μm, respectively. D, electron micrograph of lipid bodies that accumulate in PITPα nullizygous hepatocytes. The right panel is a magnification of the region identified by the box in the left panel. One lipid body is membrane-enclosed (arrow), whereas the other lacks a distinct border and is interpreted to represent a large cytoplasmic lipid droplet. Bars (from left) are 2 and 0.4 μm, respectively.
Fig. 7.
Fig. 7.. Quantification of lipid mass in PITPα+/+ and PITPα−/− brain and liver.
Brains and livers were collected from each of four freshly euthanized non-fasted PITPα+/+ and PITPα−/− mice and combined to generate defined tissue pools for each genotype. Pools were frozen and quantified for individual lipid species and FFAs via the Lipomics Technologies, Inc., TrueMass protocol. Individual lipid species are given at the top, and brain and liver values for each lipid species are given in a vertical column below each heading. Brain values are represented in the top panels, and the liver values are in the bottom panels as indicated. All lipid species are quantified as nanomoles per g of tissue. PITPα+/+ and PITPα−/− values are indicated by solid bars and hatched bars, respectively. Numerical values for each bar are given. A, neutral lipid mass measurements. B, polar lipids whose mass is unaltered in PITPα+/+ versus PITPα−/− tissues. C, polar lipids whose mass is altered in PITPα+/+ versus PITPα−/− tissues. SM, sphingomyelin; PtdEtn, phosphatidylethanolamine; PtdSer, phosphatidylserine.
Fig. 8.
Fig. 8.. Tissue-specific energy deficits in PITPα−/− mice.
A, tissue ATP levels in PITPα−/− mice. Measurements were averaged for three determinations from each of three independent P4-P6 PITPα+/+ (solid bars) and PITPα−/− animals (hatched bars). B, ATP/ADP ratios for the indicated tissues. ADP was measured indirectly by conversion to ATP and measurement of ADP-derived ATP. No significant differences in ATP or ATP/ADP ratio were observed between measurements of cerebellar hemispheres, or selected brain or liver regions, and those of whole-organ homogenates. PITPα+/+ and PITPα−/− data are in solid and hatched bars, respectively.
Fig. 9.
Fig. 9.. Hypoglycemia in PITPα−/− mice.
A, serum glucose, insulin, and β-hydroxybutyrate levels. Serum was collected from age-matched PITPα+/+ (closed bars) and PITPα−/− (hatched bars) mice. Glucose data are averaged from six age-matched PITPα+/+ and PITPα−/− mice of each genotype. Serum insulin and β-hydroxybutyrate values represent averages of triplicate measurements obtained from three mice of each genotype. Values from fasted PITPα+/+ mice (18 h) are indicated by F. B, Glc-6-Pase, phosphoenolpyruvate carboxykinase (PEPCK), and β-actin mRNA levels in PITPα+/+ and PITPα−/− liver, and proglucagon and β-actin mRNA levels in pancreas. Data are representative of at least three independent mRNA extractions and hybridizations. RNA load was normalized to 10 μg total mRNA per lane, and the β-actin data serve as indicators of normalization quality. C, glycogen was quantified for non-fasted and fasted PITPα+/+ and PITPα−/− liver, as indicated. D, kinetics of liver glycogen depletion. Age-matched PITPα+/+ (●) and PITPα−/− (□) mice with stomachs full of milk were fasted as indicated, sacrificed, and liver glycogen measured. Mean glycogen values are given for PITPα+/+ and PITPα−/− liver as solid and open bars, respectively, and statistical significance of the mean differences is given above each data set.
Fig. 10.
Fig. 10.. Pancreatic islet cells and the unfolded protein response in PITPα−/− mice.
A, number of pancreatic islets in whole pancreas from PITPα+/+ and PITPα−/− mice. Whole pancreata were recovered from each of two PITPα+/+ and PITPα−/− mice. The individual PITPα+/+ pancreata were serially sectioned into 48 and 60 consecutive sections, respectively, whereas both PITPα−/− pancreata were each sectioned into 48 serial sections. Islets were then comprehensively counted for every section of each individual pancreas so that the total number of islets per organ was determined. The data represent the averages of the two reconstructions for PITPα+/+ and PITPα−/− pancreas (solid and open bars, respectively). B, histology of endocrine pancreas. Images from hematoxylin/eosin-stained sections of PITPα+/+ and PITPα−/− pancreas. Bars are 50 μm. C, viability of PITPα+/+ (solid bars) and PITPα−/− (hatched bars) ES cells and MEFs as a function of period of glucose starvation is indicated. Living cells were identified by a trypan blue exclusion assay. D, ER stress-induced inhibition of protein synthesis. MEFs of appropriate genotype (PITPα+/+, solid bars; PITPα−/−, hatched bars) were incubated in the presence or absence of 10 mM dithiothreitol (DTT; 15 min) or 1 μm thapsigargin (Tg; 30 min) prior to and during a 20-min pulse-radiolabeling with [35S]methionine (100 μCi/ml). Relative incorporation of radiolabel into protein was quantified as trichloroacetic acid-precipitable radioactivity and is presented as an average percentage of that measured for mock-treated control cells (100%). Values are derived from triplicate determinations from three independent experiments. PITPα+/+ and PITPα−/− MEFs exhibit essentially indistinguishable rates of incorporation of [35S]methionine into protein. E, CHOP and calnexin expression. Cell-free extracts were prepared from PITPα+/+ and PITPα−/− MEFs after an 18-h incubation with 0, 10, 20, and 50 μg/ml tunicamycin (at bottom). Equivalent amounts of protein were loaded for each sample (20 μg) and resolved by SDS-PAGE. Proteins were transferred to nitrocellulose, and the resulting blot was probed with anti-CHOP and anti-calnexin antibodies (Santa Cruz Biotechnology) and developed by enhanced chemiluminescence.

References

    1. Cleves AE, McGee TP, and Bankaitis VA (1991) Trends Cell Biol. 1, 30–34 - PubMed
    1. Wirtz KWA (1991) Annu. Rev. Biochem 60, 73–99 - PubMed
    1. Bankaitis VA, Aitken JR, Cleves AE, and Dowhan W (1990) Nature 347, 561–562 - PubMed
    1. Cleves AE, McGee TP, Whitters EA, Champion KM, Aitken JR, Dowhan W, Goebl M, and Bankaitis VA (1991) Cell 64, 789–800 - PMC - PubMed
    1. Kearns BG, Alb JG Jr., and Bankaitis VA (1998) Trends Cell Biol. 8, 276–282 - PubMed

Publication types

MeSH terms