

Selenium-deficient diet enhances protein oxidation and affects methionine sulfoxide reductase (MsrB) protein level in certain mouse tissues
- PMID: 12792026
- PMCID: PMC164613
- DOI: 10.1073/pnas.1332607100
Selenium-deficient diet enhances protein oxidation and affects methionine sulfoxide reductase (MsrB) protein level in certain mouse tissues
Abstract
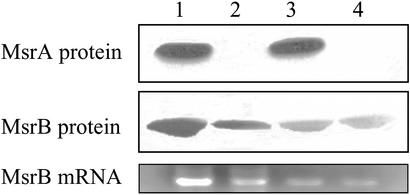
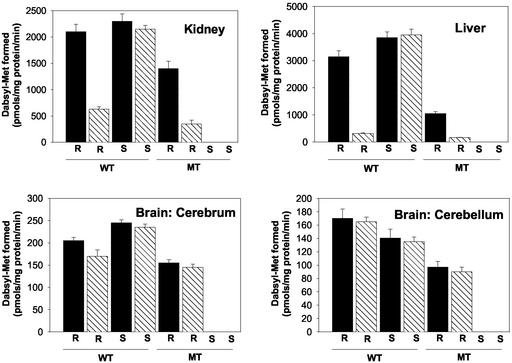
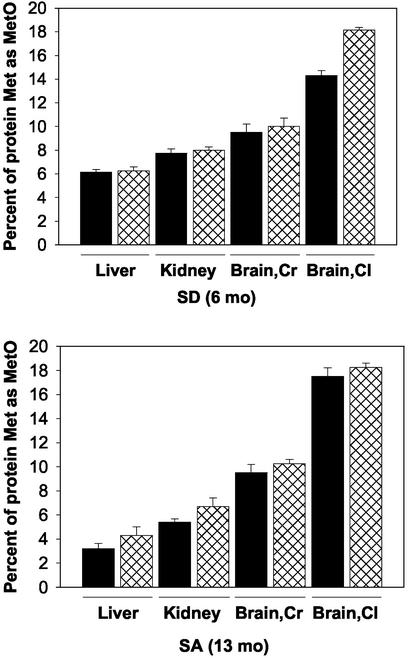
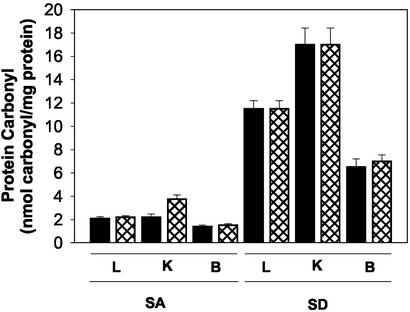
Mammals contain two methionine sulfoxide (MetO) reductases, MsrA and MsrB, that catalyze the thioredoxin-dependent reduction of the S-MetO and R-MetO derivatives, respectively, to methionine. The major mammalian MsrB is a selenoprotein (except in the heart). Here, we show that there is a loss of MsrB activity in the MsrA-/- mouse that correlates with parallel losses in the levels of MsrB mRNA and MsrB protein, suggesting that MsrA might have a role in MsrB transcription. Moreover, mice that were grown on a selenium-deficient (SD) diet showed a substantial decrease in the levels of MsrB-catalytic activity, MsrB protein, and MsrB mRNA in liver and kidney tissues of both WT and MsrA-/- mouse strains. Whereas no significant protein-MetO could be detected in tissue proteins of young mature mice grown on a selenium-adequate diet, growth on the SD diet led to substantial accumulations of MetO in proteins and also of protein carbonyl derivatives in the liver, kidney, cerebrum, and cerebellum, respectively. In addition, accumulation of protein-MetO derivatives increased with age in tissues of mice fed with a selenium-adequate diet. It should be pointed out that even though the total Msr level is at least 2-fold higher in WT than in MsrA-/- mice, SD diet causes an equal elevation of protein-MetO (except in brain cerebellum) and carbonyl levels in both strains, suggesting involvement of other selenoproteins in regulation of the level of cellular protein-MetO accumulation. Furthermore, the development of the "tip-toe" walking behavior previously observed in the MsrA-/- mice occurred earlier when they were fed with the SD diet.
Figures
Similar articles
-
Prolonged selenium-deficient diet in MsrA knockout mice causes enhanced oxidative modification to proteins and affects the levels of antioxidant enzymes in a tissue-specific manner.Free Radic Res. 2007 Feb;41(2):162-71. doi: 10.1080/10715760600978823. Free Radic Res. 2007. PMID: 17364942
-
Specific activity of methionine sulfoxide reductase in CD-1 mice is significantly affected by dietary selenium but not zinc.Biol Trace Elem Res. 2007 Mar;115(3):265-76. doi: 10.1007/BF02686001. Biol Trace Elem Res. 2007. PMID: 17625247
-
Selenium and the methionine sulfoxide reductase system.Molecules. 2009 Jul 1;14(7):2337-44. doi: 10.3390/molecules14072337. Molecules. 2009. PMID: 19633607 Free PMC article. Review.
-
Roles of methionine suldfoxide reductases in antioxidant defense, protein regulation and survival.Curr Pharm Des. 2005;11(11):1451-7. doi: 10.2174/1381612053507846. Curr Pharm Des. 2005. PMID: 15853675 Review.
-
MsrB1 (methionine-R-sulfoxide reductase 1) knock-out mice: roles of MsrB1 in redox regulation and identification of a novel selenoprotein form.J Biol Chem. 2009 Feb 27;284(9):5986-93. doi: 10.1074/jbc.M805770200. Epub 2008 Nov 6. J Biol Chem. 2009. PMID: 18990697 Free PMC article.
Cited by
-
Novel aspects of macromolecular repair and relationship to human disease.J Mol Med (Berl). 2004 May;82(5):280-97. doi: 10.1007/s00109-004-0528-1. Epub 2004 Feb 24. J Mol Med (Berl). 2004. PMID: 14985856 Review.
-
Selenium level and cognitive function in rural elderly Chinese.Am J Epidemiol. 2007 Apr 15;165(8):955-65. doi: 10.1093/aje/kwk073. Epub 2007 Jan 31. Am J Epidemiol. 2007. PMID: 17272290 Free PMC article.
-
The Role of Methionine Oxidation/Reduction in the Regulation of Immune Response.Curr Signal Transduct Ther. 2009 Jan 1;4(1):46-50. doi: 10.2174/157436209787048748. Curr Signal Transduct Ther. 2009. PMID: 19823697 Free PMC article.
-
Identification of a signature motif for the eIF4a3-SECIS interaction.Nucleic Acids Res. 2011 Sep 1;39(17):7730-9. doi: 10.1093/nar/gkr446. Epub 2011 Jun 17. Nucleic Acids Res. 2011. PMID: 21685449 Free PMC article.
-
Cubilin and megalin in radiation-induced renal injury with labelled somatostatin analogues: are we just dealing with the kidney?Eur J Nucl Med Mol Imaging. 2005 Oct;32(10):1131-5. doi: 10.1007/s00259-005-1885-x. Eur J Nucl Med Mol Imaging. 2005. PMID: 16133381 No abstract available.
References
-
- Moskovitz, J., Poston, M., Berlett, B. S., Nosworthy, J. N., Szczepanowski, R. & Stadtman, E. R. (2000) J. Biol. Chem. 275, 14167–14172. - PubMed
-
- Sharov, V. S., Ferrington, D. A., Squier, T. C. & Schoneich, C. (1999) FEBS Lett. 455, 247–250. - PubMed
-
- Moskovitz, J., Singh, V. K., Requena, J., Wilkinson, B. J., Jayaswal, R. K. & Stadtman, E. R. (2002) Biochem. Biophys. Res. Commun. 290, 62–65. - PubMed
-
- Grimaud, R., Ezraty, B., Mitchell, J. K., Lafitte, D., Briand, C., Derrick, P. J. & Barras, F. (2001) J. Biol. Chem. 276, 48915–48920. - PubMed
-
- Orly, A., Boschi-Muller, S., Marrand, M., Sanglier-Cianferani, S., Van Dorsselear, A. & Branlant, G. (2002) J. Biol. Chem. 277, 12016–12022. - PubMed
MeSH terms
Substances
LinkOut - more resources
Full Text Sources
Other Literature Sources
Molecular Biology Databases
