

The TTX-resistant sodium channel Nav1.8 (SNS/PN3): expression and correlation with membrane properties in rat nociceptive primary afferent neurons
- PMID: 12794175
- PMCID: PMC2343087
- DOI: 10.1113/jphysiol.2003.042127
The TTX-resistant sodium channel Nav1.8 (SNS/PN3): expression and correlation with membrane properties in rat nociceptive primary afferent neurons
Abstract
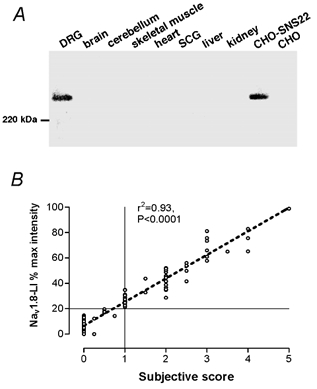
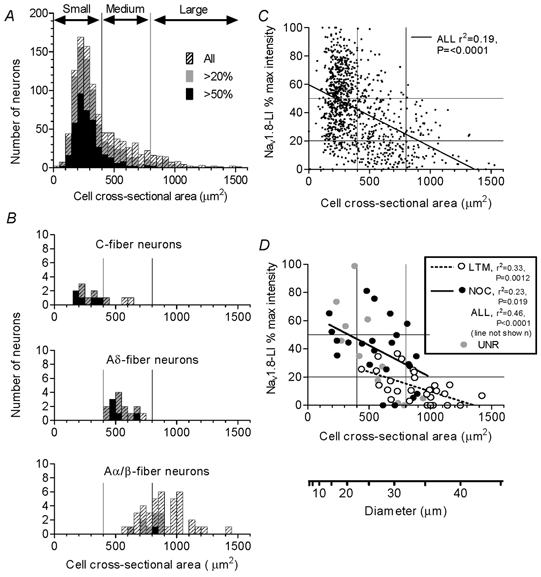
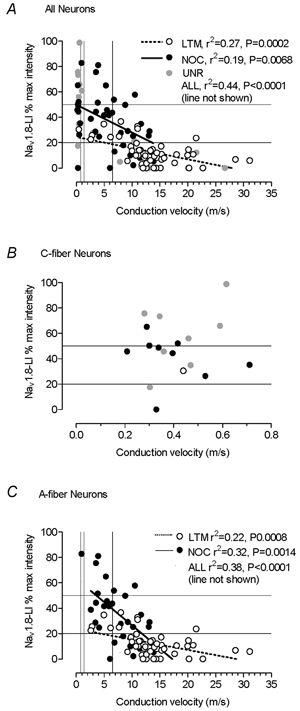
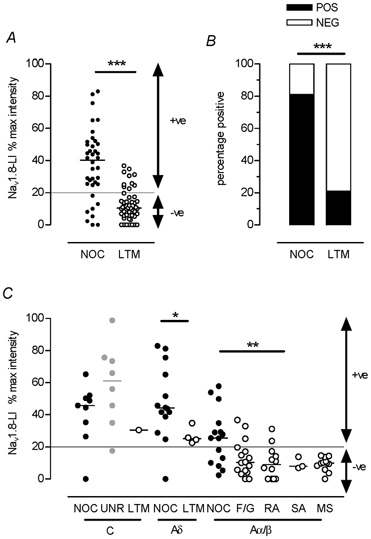
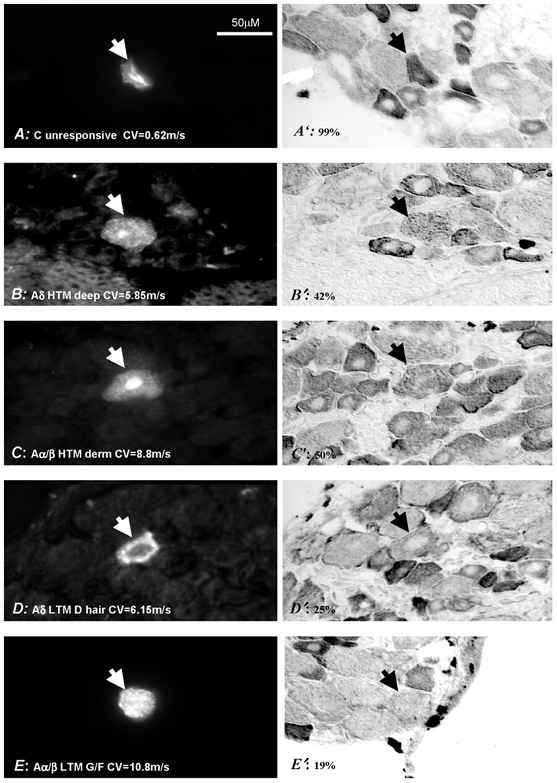
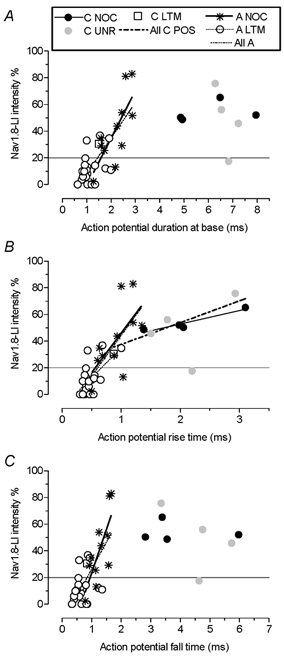
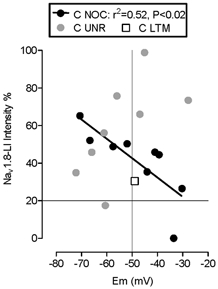
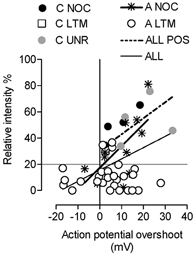
We have examined the distribution of the sensory neuron-specific Na+ channel Nav1.8 (SNS/PN3) in nociceptive and non-nociceptive dorsal root ganglion (DRG) neurons and whether its distribution is related to neuronal membrane properties. Nav1.8-like immunoreactivity (Nav1.8-LI) was examined with an affinity purified polyclonal antiserum (SNS11) in rat DRG neurons that were classified according to sensory receptive properties and by conduction velocity (CV) as C-, Adelta- or Aalpha/beta. A significantly higher proportion of nociceptive than low threshold mechanoreceptive (LTM) neurons showed Nav1.8-LI, and nociceptive neurons had significantly more intense immunoreactivity in their somata than LTM neurons. Results showed that 89, 93 and 60% of C-, Adelta- and Aalpha/beta-fibre nociceptive units respectively and 88% of C-unresponsive units were positive. C-unresponsive units had electrical membrane properties similar to C-nociceptors and were considered to be nociceptive-type neurons. Weak positive Nav1.8-LI was also present in some LTM units including a C LTM, all Adelta LTM units (D hair), about 10% of cutaneous LTM Aalpha/beta-units, but no muscle spindle afferent units. Nav1.8-LI intensity was negatively correlated with soma size (all neurons) and with dorsal root CVs in A- but not C-fibre neurons. Nav1.8-LI intensity was positively correlated with action potential (AP) duration (both rise and fall time) in A-fibre neurons and with AP rise time only in positive C-fibre neurons. It was also positively correlated with AP overshoot in positive neurons. Thus high levels of Nav1.8 protein may contribute to the longer AP durations (especially in A-fibre neurons) and larger AP overshoots that are typical of nociceptors.
Figures
Similar articles
-
Association of somatic action potential shape with sensory receptive properties in guinea-pig dorsal root ganglion neurones.J Physiol. 1998 Dec 15;513 ( Pt 3)(Pt 3):857-72. doi: 10.1111/j.1469-7793.1998.857ba.x. J Physiol. 1998. PMID: 9824723 Free PMC article.
-
Sensory and electrophysiological properties of guinea-pig sensory neurones expressing Nav 1.7 (PN1) Na+ channel alpha subunit protein.J Physiol. 2003 Jan 15;546(Pt 2):565-76. doi: 10.1113/jphysiol.2002.026559. J Physiol. 2003. PMID: 12527742 Free PMC article.
-
The presence and role of the tetrodotoxin-resistant sodium channel Na(v)1.9 (NaN) in nociceptive primary afferent neurons.J Neurosci. 2002 Sep 1;22(17):7425-33. doi: 10.1523/JNEUROSCI.22-17-07425.2002. J Neurosci. 2002. PMID: 12196564 Free PMC article.
-
Phenotype and function of somatic primary afferent nociceptive neurones with C-, Adelta- or Aalpha/beta-fibres.Exp Physiol. 2002 Mar;87(2):239-44. Exp Physiol. 2002. PMID: 11856969 Review.
-
Abeta-fiber nociceptive primary afferent neurons: a review of incidence and properties in relation to other afferent A-fiber neurons in mammals.Brain Res Brain Res Rev. 2004 Oct;46(2):131-45. doi: 10.1016/j.brainresrev.2004.07.015. Brain Res Brain Res Rev. 2004. PMID: 15464202 Review.
Cited by
-
Attenuation of autonomic reflexes by A803467 may not be solely caused by blockade of NaV 1.8 channels.Neurosci Lett. 2013 May 24;543:177-82. doi: 10.1016/j.neulet.2013.03.015. Epub 2013 Mar 21. Neurosci Lett. 2013. PMID: 23523647 Free PMC article.
-
A review of dorsal root ganglia and primary sensory neuron plasticity mediating inflammatory and chronic neuropathic pain.Neurobiol Pain. 2024 Jan 20;15:100151. doi: 10.1016/j.ynpai.2024.100151. eCollection 2024 Jan-Jun. Neurobiol Pain. 2024. PMID: 38314104 Free PMC article. Review.
-
Kv4 Channels Underlie the Subthreshold-Operating A-type K-current in Nociceptive Dorsal Root Ganglion Neurons.Front Mol Neurosci. 2009 Jul 7;2:3. doi: 10.3389/neuro.02.003.2009. eCollection 2009. Front Mol Neurosci. 2009. PMID: 19668710 Free PMC article.
-
Neuropathy following spinal nerve injury shares features with the irritable nociceptor phenotype: A back-translational study of oxcarbazepine.Eur J Pain. 2019 Jan;23(1):183-197. doi: 10.1002/ejp.1300. Epub 2018 Aug 28. Eur J Pain. 2019. PMID: 30091265 Free PMC article.
-
Loss-of-function of Nav1.8/D1639N linked to human pain can be rescued by lidocaine.Pflugers Arch. 2018 Dec;470(12):1787-1801. doi: 10.1007/s00424-018-2189-x. Epub 2018 Aug 11. Pflugers Arch. 2018. PMID: 30099632
References
-
- Akopian AN, Sivilotti L, Wood JN. A tetrodotoxin-resistant voltage-gated sodium channel expressed by sensory neurons. Nature. 1996;379:257–262. - PubMed
-
- Akopian AN, Souslova V, England S, Okuse K, Ogata N, Ure J, Smith A, Kerr BJ, McMahon SB, Boyce S, Hill R, Stanfa LC, Dickenson AH, Wood JN. The tetrodotoxin-resistant sodium channel SNS has a specialized function in pain pathways. Nat Neurosci. 1999;2:541–548. - PubMed
-
- Amaya F, Decosterd I, Samad TA, Plumpton C, Tate S, Mannion RJ, Costigan M, Woolf CJ. Diversity of expression of the sensory neuron-specific TTX-resistant voltage-gated sodium ion channels SNS and SNS2. Mol Cell Neurosci. 2000;15:331–342. - PubMed
-
- Baker MD, Wood JN. Involvement of Na+ channels in pain pathways. Trends Pharmacol Sci. 2001;22:27–31. - PubMed
Publication types
MeSH terms
Substances
Grants and funding
LinkOut - more resources
Full Text Sources
Molecular Biology Databases