. 2003 Jul 15;550(Pt 2):459-92.
doi: 10.1113/jphysiol.2003.044214. Epub 2003 Jun 6.

Transient and sustained types of long-term potentiation in the CA1 area of the rat hippocampus

Affiliations

Transient and sustained types of long-term potentiation in the CA1 area of the rat hippocampus

Arturas Volianskis et al. J Physiol. .

Abstract

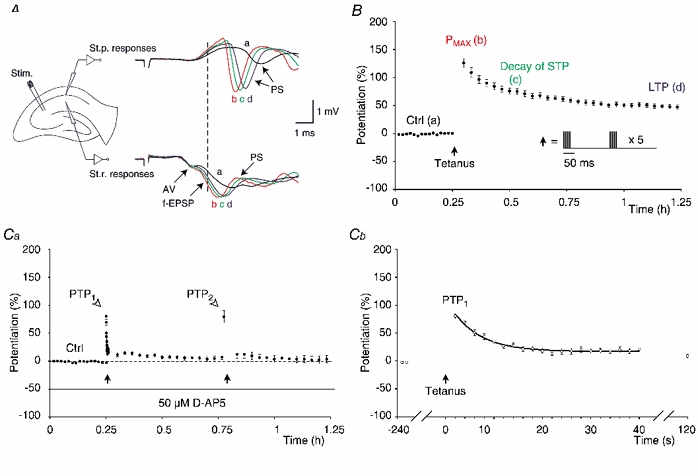
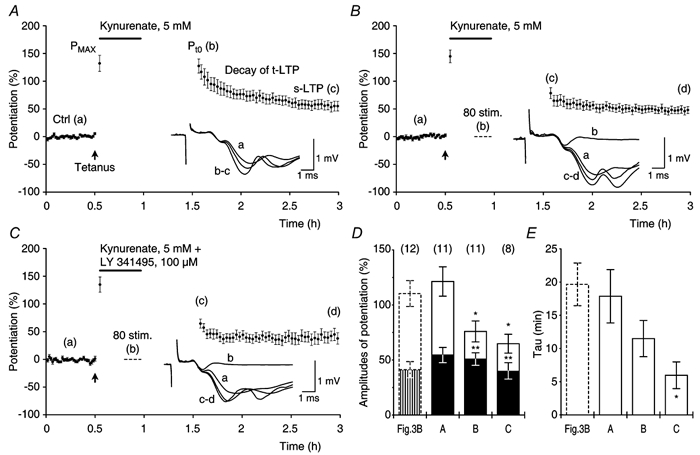
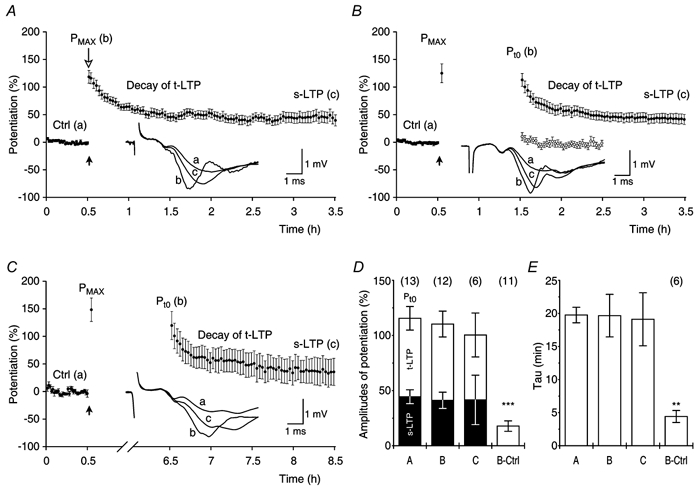
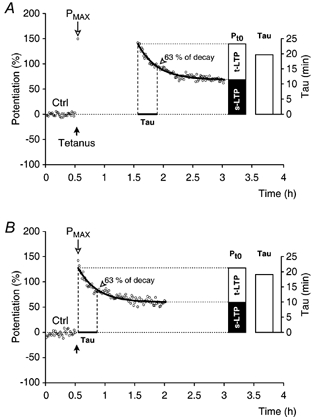
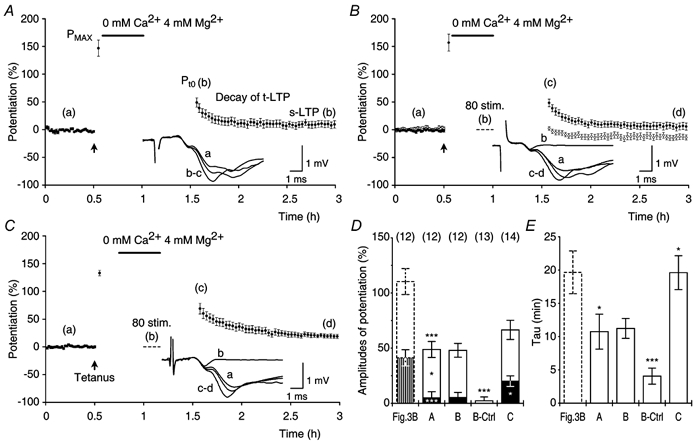
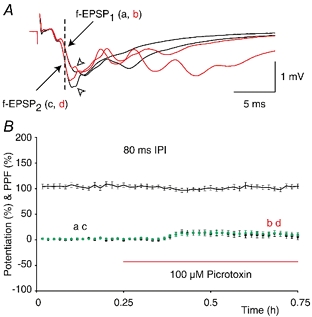
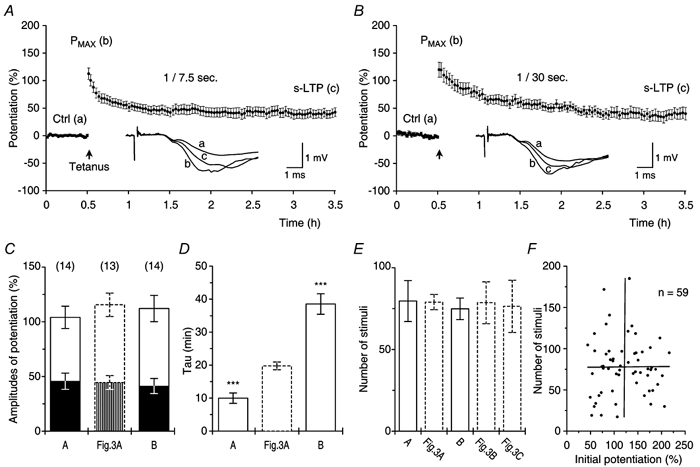
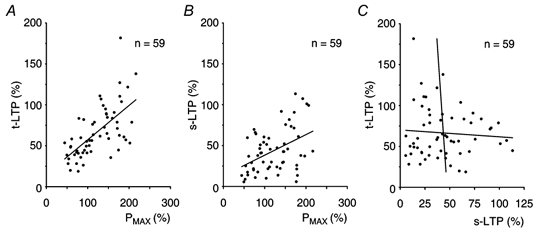
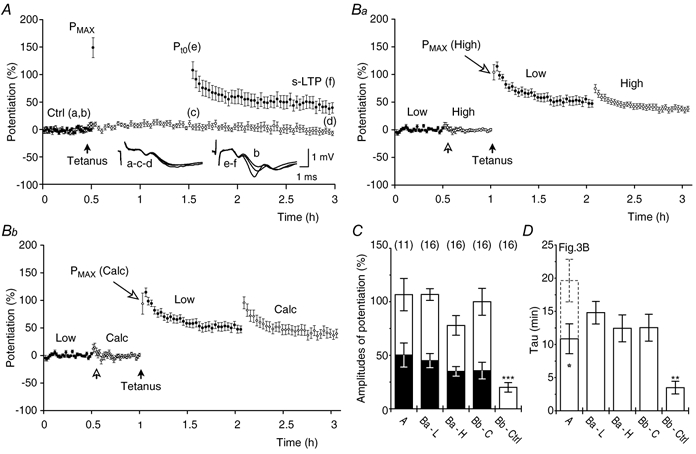
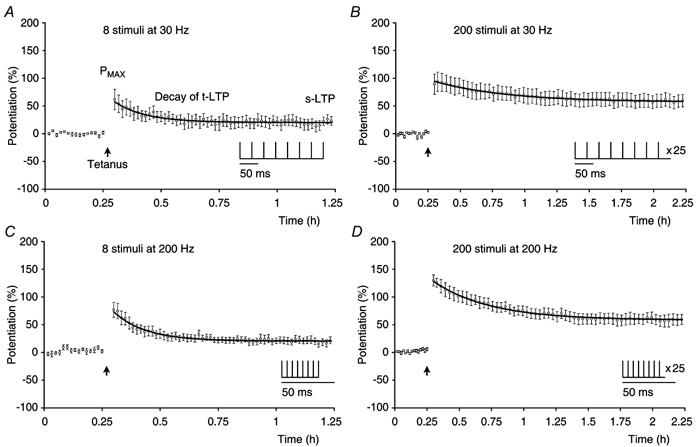
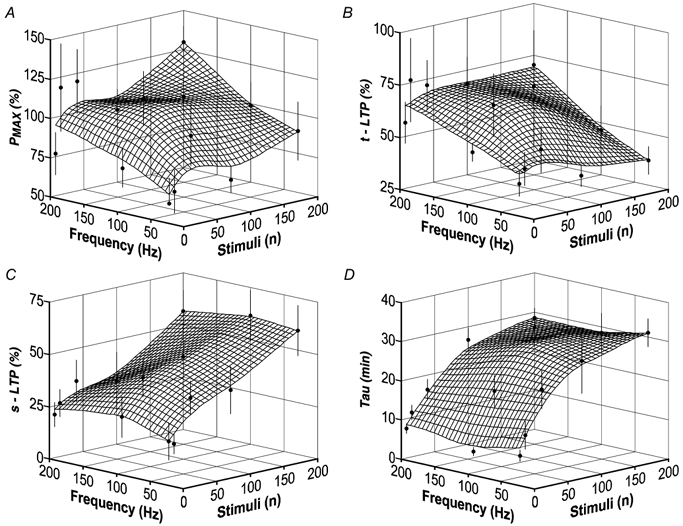
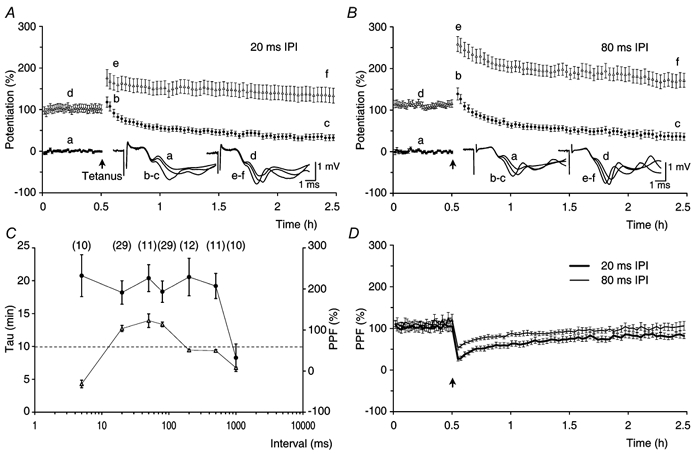
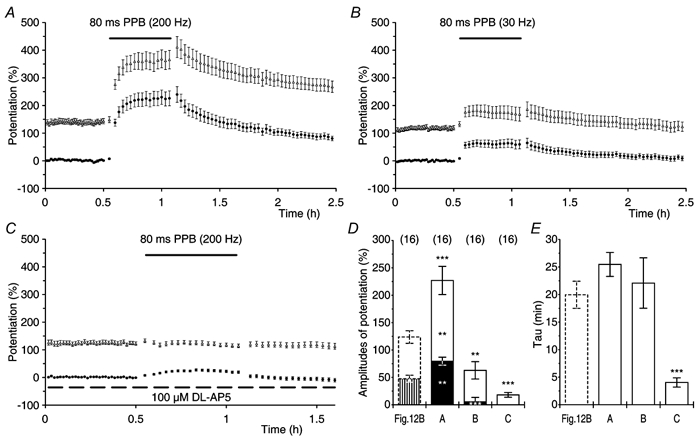
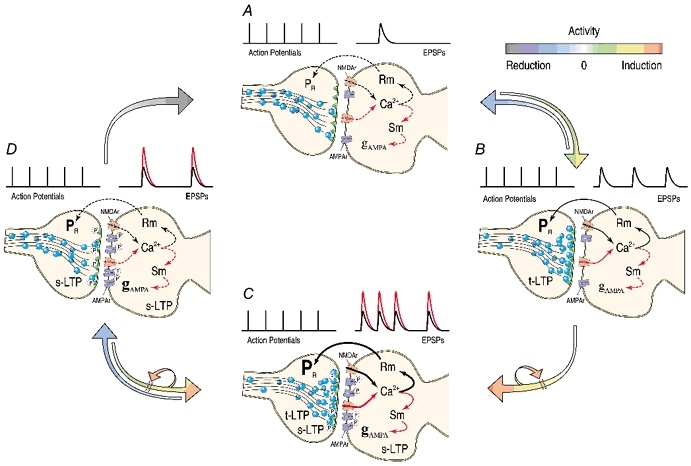
Synaptic potentiation induced by high frequency stimulation was investigated by recording field excitatory postsynaptic potentials (f-EPSPs) in rat hippocampal slices. Potentiation consisted of a transient period of decaying f-EPSPs (short-term potentiation, STP) that led to a plateau of continuously potentiated f-EPSPs (long-term potentiation, LTP). Here we show that a previously unknown type of transient, use-dependent, long-lasting potentiation (t-LTP) can account for STP. t-LTP could be stored for more than 6 h and its decay was caused by synaptic activation. Both the expression and the decay of t-LTP were input specific. t-LTP was induced differently from conventional LTP in that the amplitude of t-LTP was dependent upon the stimulation frequency, whereas the magnitude of LTP was dependent on the number of stimuli in the induction train. The decay of t-LTP could not be prevented by the blockage of glutamate receptors, but was prevented by the blockage of stimulus-evoked neurotransmitter release, suggesting that t-LTP is expressed presynaptically. Paired-pulse stimulation experiments showed that the decay of t-LTP was mediated by a decrease in the probability of neurotransmitter release. The decline of t-LTP could be prolonged by the activation of NMDA receptors. Hence, both single and paired-pulse stimuli prolonged the decline of the t-LTP. This decline could be prevented by high frequency burst stimulation (200 Hz). We conclude that t-LTP allows dynamic modulation of synaptic transmission by providing not only spatial association but also temporal convergence between synaptic inputs. Therefore, t-LTP might be a substrate for the encoding of synaptic memory.


Figures

Figure 1
Figure 1. Potentiation in the CA1 area of the hippocampus
A, schematic illustration of the experimental situation that was used to study potentiation of synaptic transmission in the CA1 area of hippocampal slices. The stimulation electrode was placed in the Schaffer collaterals on the border between the areas CA1 and CA2. Recording electrodes were placed in the stratum pyramidale (St.p.) and the stratum radiatum (St.r.) of the CA1 area in order to record the population spikes and the field excitatory postsynaptic potentials, respectively. The waveforms, recorded before and after tetanisation of the Schaffer collaterals, are shown on the right of the corresponding recording electrodes. Their labelling and colours correspond to different time points before and after the tetanisation: ‘a’ before tetanisation (black), ‘b’ 2 min after the tetanisation (red), ‘c’ 15 min post-tetanus (green), ‘d’ 1 h post-tetanus (blue). Three components of the waveforms are indicated by the arrows: (1) the afferent fibre volley (AV), (2) the field excitatory postsynaptic potential (f-EPSP) and (3) the population spike (PS). The points of the initial rising phase of the f-EPSPs (indicated by the dashed line through the stratum radiatum responses) that were neither affected by the afferent volley nor by the population spikes were used to calculate changes in synaptic transmission. The calibration bar is shown in the inset. B, a group of experiments (n = 16, • mean estimates of potentiation, the error bars indicate s.e.m.) depicting the control level of synaptic transmission (Ctrl), the initial amounts of potentiation at 2 min post-tetanus (Pmax, 128 ± 8.8 %), the decay of STP (81 ± 6.7 %) and the LTP (47 ± 3.7 %). Potentiation of synaptic transmission was calculated by subtracting the 100 % level from the relative change in synaptic transmission. The amplitudes of STP were estimated by subtracting the amplitudes of the LTP from those of the Pmax in the individual experiments. Labelling and colours correspond to the sample waveforms in A. Filled arrow indicates the time of tetanisation and the tetanisation protocol, consisting of a number of theta-bursts, is depicted in the inset. Ca, in this group of experiments (n = 16) 50 μM D-AP5 (indicated by the continuous line) was applied in order to isolate the PTP. The amplitude of PTP (open arrowhead) was estimated at 2 s after the first tetanisation (left filled arrow) and amounted to 80 ± 4.9 % (PTP1). Twenty stimuli were then delivered at a frequency of 0.5 Hz. The stimulation was then resumed at 2 min post-tetanus (8 ± 3.9 %) and the decline in potentiation was followed for 30 min (6 ± 3.7 %). The slices were tetanised again (right filled arrow) and the amplitude of PTP2 was estimated after 2 s (80 ± 11.0 %). The stimulation was resumed at 2 min post-tetanus (9 ± 6.9 %) and the potentiation was followed for the next 30 min (3 ± 6.9 %). The dashed line indicates the control level. Cb, the decay of the PTP1 (from Ca) is shown on another time-scale (○). PTP1 declined in a mono-exponential manner (continuous line) with a time constant (τ) of 6.2 ± 0.5 s.
Figure 9
Figure 9. Glutamate receptor antagonists do not prevent decay of transient LTP
A, experiments (n = 12) in which t-LTP and s-LTP were induced by theta-burst stimulation (filled arrow). After the induction of potentiation Pmax was recorded (132 ± 14.6 %) and kynurenate (5 mM, continuous line) was applied for 25 min and then washed out (35 min). After the wash-out of kynurenate potentiations were: Pt0 = 121 ± 13.3 %, t-LTP = 67 ± 14.1 % and s-LTP = 55 ± 6.9 %. The τ of t-LTP was 18 ± 4.0 min. B, similar to A except that a series of 80 test stimuli (1/7.5 s, dashed line) were delivered in the presence of kynurenate. 5 mM kynurenate blocked f-EPSPs 15 min after its application (inset trace b). Note that the amplitude of t-LTP was reduced compared with that in A, when tested after the wash-out of kynurenate. Pmax = 145 ± 11.4 %, Pt0 = 76 ± 9.5 %, t-LTP = 26 ± 5.3 %, s-LTP = 51 ± 5.7 % and τ of t-LTP = 11.5 ± 2.7 min. C, similar to B except that the metabotropic glutamate receptor antagonist LY341495 (100 μM) was applied together with kynurenate. Pmax = 135 ± 13.8 %, Pt0 = 64 ± 8.5 %, t-LTP = 25 ± 8.2 %, s-LTP = 40 ± 7.5 % and τ of t-LTP = 6.0 ± 2.0 min. D, Pt0, t-LTP and s-LTP in the control experiments (Fig. 3B) were compared with the respective amplitudes of potentiation in A, B and C. Application of kynurenate in A (A) did not affect the amplitudes of potentiation (P > 0.2, all cases). The experimental groups B and C showed lower Pt0 and t-LTP (P < 0.05, all cases), whereas the amplitudes of s-LTP were similar to those of the control (P > 0.2, in both cases). E, decay time constants of t-LTP for the experimental groups in D. Decay time constants in A (A) and B (B) were similar to those of the control (P > 0.07). The τ in C (C) was smaller than that of the control (P < 0.01).
Figure 3
Figure 3. Long-term storage of the transient phase of potentiation
A, a group of 13 experiments in which potentiation of synaptic transmission was tested after a 2 min delay in test stimulation after tetanisation (as in Fig. 2B, ±s.e.m.). Mean amplitudes of potentiation that were estimated in the individual experiments were: Pmax = 118 ± 11.5 %, Pt0 = 116 ± 10.7 %, t-LTP = 71 ± 10.6 %, s-LTP = 44 ± 6.3 %. The τ of t-LTP was 20 ± 1.2 min. Averaged f-EPSPs, from the experiment in Fig. 2B, for the time periods as indicated by the letters, are displayed in the inset together with the calibration bar. B, in a group of 12 experiments the testing of potentiation was delayed for a period of 1 h (as in Fig. 2A) after recording the Pmax (•). Pmax = 125 ± 17.1 %, Pt0 = 110 ± 11.7 %, t-LTP = 69 ± 9.0 %, s-LTP = 41 ± 7.3 %. The τ of t-LTP was 20 ± 3.2 min. Averaged f-EPSPs, from the experiment in Fig. 2A, are displayed in the inset. ○, control experiments without tetanisation (n = 11). In these, resuming stimulation after 1 h revealed a small facilitation of the f-EPSPs (18 ± 4.7 %) that decayed (τ = 4.4 ± 0.9 min) to −6 ± 5.4 % of potentiation. C, experiments in which stimulation was discontinued for a period of 6 h (n = 6). In order to ensure a correct estimation of potentiation, single experiments in this group were adjusted for changes in the afferent fibre volley off-line. Pmax = 148 ± 21.3 %, Pt0 = 100 ± 19.9 %, t-LTP = 59 ± 9.7 %, s-LTP = 42 ± 22.4 % and τ of t-LTP = 19 ± 4.0 min. D, mean amplitudes of potentiation that were reached under the experimental conditions in A, B and Cs.e.m.). Entire bars represent Pt0, filled bars s-LTP and open bars t-LTP (according to the histograms in Fig. 2). The amplitudes of potentiation in the experiments with either 1 h (B) or 6 h (C) delay in test stimulation after tetanisation, were not different from those in the control group (A, P ≥ 0.5, all cases). These amplitudes were different from those associated with facilitation of the f-EPSPs in the non-tetanised control (B-Ctrl, P < 0.0001, all cases). Group sizes are indicated in parentheses. E, decay time constants of t-LTP in B (B) or C (C) were not different from those in A (A, P ≥ 0.8, both cases) but were different from the τ values in experiments without tetanisation (B-Ctrl, P < 0.01, both cases). Note that only 6 of 11 non-tetanised experiments could be fitted by the mono-exponential function.
Figure 2
Figure 2. Transient and sustained phases of potentiation
A, a single experiment (○) in which, after recording the control period (Ctrl), the slice was tetanised (theta-burst stimulation, filled arrow) and the mean amplitude of potentiation was recorded at 2 min post-tetanus (Pmax). Test stimulation (1/15 s) was then discontinued for a period of 1 h. After resuming the test stimulation, transient (t-LTP) and sustained (s-LTP) phases of synaptic potentiation were followed for a period of 1.5 h. Potentiation was fitted to a mono-exponential function (see text), which is shown superimposed on the data (thick line). Constants (Pt0, t-LTP, s-LTP and τ) that were estimated by the fitting are visualised in the histograms. B, an experiment similar to that in A except that the test stimulation was not delayed after the Pmax amplitude was recorded.
Figure 10
Figure 10. Decrease of transient and sustained LTP in calcium-free medium
A, in a group of experiments (n = 12), potentiation was induced by theta-burst stimulation, Pmax (147 ± 14.6 %) was recorded and Ca2+-free medium was applied for 25 min (0 mM Ca2+, 4 mM Mg2+, filled bar). Potentiations, 35 min after returning to normal medium, were: Pt0 = 49 ± 7.2 %, t-LTP = 44 ± 6.0 %, s-LTP = 5 ± 5.6 % and τ of t-LTP = 10.7 ± 2.6 min. B, similar to A (•, n = 12) except that 80 stimuli (1/7.5 s) were delivered during the last 10 min of the exposure to Ca2+-free medium (dashed line, inset trace b). Pmax = 157 ± 15.3 %, Pt0 = 48 ± 6.3 %, t-LTP = 43 ± 4.2 %, s-LTP = 5 ± 4.6 % and τ of t-LTP = 11.2 ± 1.5 min. ○, experiments in which slices were not tetanised (n = 13). Testing, after returning to normal medium, revealed a small facilitation of f-EPSPs (2 ± 3.5 %) that decayed to a potentiation of −11 ± 5.1 % with a τ of 4.1 ± 1.2 min. C, a group of experiments (n = 14) in which, 15 min after tetanisation, Ca2+-free medium was applied for 25 min. Testing, 20 min after returning to normal medium, showed both t-LTP and s-LTP: Pmax = 133 ± 5.0 %, Pt0 = 67 ± 8.7 %, t-LTP = 46 ± 6.0 % and s-LTP = 20 ± 4.8 %. τ of t-LTP = 19.6 ± 2.5 min. D, the amplitudes of Pt0, t-LTP and s-LTP in A (A) were smaller than those in the standard experiments (Fig. 3B, P < 0.05, all cases). The amplitudes of potentiation after the application of 80 stimuli in B (B) were not different from those in A (A) (P ≥ 0.9, all cases). Estimates of the amount of potentiation in the experiments in which slices were not tetanised (B-Ctrl) were different from those recorded in B (B) (P < 0.0001, all cases). A later application of Ca2+-free medium in C (C) resulted in a larger s-LTP (P < 0.05) when compared with s-LTP in B (B), whereas Pt0 and t-LTP were not affected (P > 0.1, both cases). E, the τ of t-LTP in A (A) was smaller than that of the control (P < 0.05, Fig. 3B). Decay time constants in B (B) were similar to those in A (A) (P = 0.9) and larger than the decay time constants observed in experiments without tetanisation (P < 0.001, B-Ctrl). Decay time constants of t-LTP in C (C) were larger than those in A (A) and B (B) (P < 0.05, both cases).
Figure 11
Figure 11. Measurement of paired-pulse facilitation
A, superimposed f-EPSPs (indicated by the two arrows) from an experiment in which paired-pulse (PP) stimulation was given with an inter-pulse interval (IPI) of 80 ms. Black waveforms show control f-EPSP1 (a) and f-EPSP2 (c) in standard medium. Red waveforms (b and d) show the respective potentials after the application of the GABAA receptor antagonist picrotoxin (100 μM). The dashed line indicates the point on the initial rising phase of the f-EPSPs that was used to analyse this and other experiments (as described in Fig. 1). The open arrowheads point to the decreases in amplitudes of the f-EPSPs that were caused by the application of picrotoxin. Calibration bar is shown in the inset. B, a group of experiments in which the effects of the picrotoxin on PPF were established (n = 16, IPI = 80 ms). Picrotoxin (100 μM) was applied at the time indicated by the red continuous line. The letter labels correspond to the sample waveforms presented in A. PPF, shown by the black continuous line (±s.e.m.), was 104 ± 3.6 % in control conditions and 103 ± 3.7 % after the application of picrotoxin (P = 0.8, paired t test). The • show potentiation of f-EPSP1 (9 ± 5.4 %) whereas the green circles show the potentiation of f-EPSP2 (11 ± 4.7 %). The two potentiations were similar (P = 0.6, paired t test).
Figure 4
Figure 4. Transient LTP decays in an activity dependent manner
A, potentiation, induced by theta-burst stimulation (filled arrow), was investigated with test stimuli delivered once every 7.5 s (n = 14) and resulted in Pt0 = 104 ± 10.2 %, t-LTP = 58 ± 7.7 %, s-LTP = 46 ± 7.4 %. The τ of t-LTP was 10 ± 1.6 min. B, potentiation tested with test stimulation delivered once every 30 s (n = 14). Pt0 = 112 ± 12.0 %, t-LTP = 71 ± 8.6 %, s-LTP = 41 ± 6.9 %. The τ of t-LTP was 39 ± 3.1 min. C, no differences were found between the amplitudes of potentiation (Pt0, t-LTP and s-LTP) in A (A) and B (B) and those in standard experiments tested at 1/15 s (Fig. 3A, P ≥ 0.3 in all cases). Data, imported from the preceding figures, are presented as dashed bars in this and all the following histograms. D, the decay time of t-LTP, tested without a delay in stimulation, was inversely related to the frequency of test stimulation. The τ of t-LTP tested at 1/7.5 s (A), and the τ of t-LTP tested at 1/30 s (B), were different from the τ of t-LTP tested at 1/15 s (Fig. 3A, P < 0.0001, both cases). E, the mean numbers of stimuli that were needed to reduce t-LTP to 37 % of its amplitude were constant: A, 79.7 ± 12.6 stimuli at 1/7.5 s; Fig. 3A, 79.0 ± 4.7 stimuli at 1/15 s; B, 74.9 ± 6.6 stimuli at 1/30 s; t-LTP tested at 1/15 s, with a delay in test stimulation for either 1 h (Fig. 3B) or 6 h (Fig. 3C), was reduced to 37 % of its amplitude in response to 78.6 ± 12.9 stimuli and 76.4 ± 16.0 stimuli, respectively. F, the numbers of stimuli needed to decrease t-LTP to 37 % of its amplitude were not correlated (P = 0.9, ANOVA, R = 0.01) to the amount of initial potentiation (Pmax).
Figure 5
Figure 5. Dependence of transient and sustained LTP on the ability of slices to express potentiation
A, the amplitude of t-LTP in single experiments (Figs 3 and 4, n = 59) was positively correlated with the initial amount of potentiation (Pmax) induced in slice preparations (P < 0.0001, ANOVA, R = 0.63). B, the amplitude of s-LTP was dependent on the amplitude of Pmax (P < 0.001, ANOVA, R = 0.45). C, the amplitudes of t-LTP and s-LTP were expressed independently of each other (P > 0.6, ANOVA, R = 0.06).
Figure 6
Figure 6. Transient LTP can be stored in synaptic sub-populations
A, two-pathway experiments (n = 11) in which potentiation was induced in one of the pathways (•) with theta-burst stimulation (filled arrow). Potentiation was tested 1 h after tetanisation at a frequency of 1/15 s. In the tetanised pathway: Pt0 = 106 ± 15.0 %, t-LTP = 57 ± 6.4 %, s-LTP = 50 ± 11.2 % and the τ of t-LTP = 10.9 ± 2.2 min. The non-tetanised control pathway (○) showed little change. Average f-EPSPs from one of the experiments are shown in the inset. Ba, single-pathway experiments (n = 16) tested with two different stimulation intensities (Low = 2 × threshold and High = 4 × threshold for evoking f-EPSPs). The open arrow indicates intensity change. Tetanisation (filled arrow) was given at high intensity. Potentiation was tested at low intensity for 1 h followed by a 1 h test at high intensity. Data were normalised to their respective controls and presented as potentiation. Potentiation at low intensity (•) was: Pt0 = 107 ± 5.5 %, t-LTP = 62 ± 6.5 % and s-LTP = 45 ± 6.6 %. The τ of t-LTP was 14.8 ± 1.7 min. Potentiation at high intensity (○ was: Pt0 = 78 ± 9.2 %, t-LTP = 43 ± 9.9 % and s-LTP = 35 ± 4.5 %. The τ of t-LTP was 12.4 ± 2.0 min. Bb, subtraction (see text) was used to estimate t-LTP and s-LTP in synapses that were additionally recruited (Calc, ⋄) by the high intensity test stimulation. Pt0 = 99 ± 12.5 %, t-LTP = 64 ± 10.6 %, s-LTP = 36 ± 7.8 % and the τ of t-LTP = 12.5 ± 2.0 min. Potentiation that was tested with low intensity stimulation is reproduced from Ba for comparison (•). C, the amplitudes of Pt0, t-LTP and s-LTP from the tetanised pathway in A (A), from the low stimulation intensity (Ba-L) and the high stimulation intensity (Ba-H) pathways in Ba, and from the calculated pathway (Bb-C) in Bb. The changes in synaptic transmission that were caused by an increase in the stimulation intensity during the control periods (Bb-Ctrl) in Bb were different from the potentiations (Ba-L, Ba-H and Bb-C) obtained after the tetanisation (P < 0.001, all cases, paired t test). D, the decay time constants of t-LTP that were found in the experiments in A (A) were different from those of t-LTP that were tested 1 h after tetanisation in the control experiments (Fig. 3B, dashed bar, P < 0.05). The decay time constants of t-LTP from the experiments in B (Ba-L, Ba-H and Bb-C) were different from those that were caused by an increase in the stimulus intensity during the control periods (Bb-Ctrl, P < 0.01, in all cases, paired t test).
Figure 7
Figure 7. Induction of transient and sustained LTP
Experiments (n = 8, ○) showing t-LTP and s-LTP expressed after different patterns of induction as depicted in the insets. Tetanisation (filled arrow) was: A, 8 stimuli at 30 Hz; B, 200 stimuli at 30 Hz; C, 8 stimuli at 200 Hz and D, 200 stimuli at 200 Hz. Mono-exponential decaying functions were fitted to the mean potentiations in the experimental groups and are shown superimposed on the data (black lines). The calculated constants, given as best fit ± estimated error of constant were: A, t-LTP = 37.0 ± 9.3 %, s-LTP = 20.3 ± 1.7 % and τ = 8.2 ± 2.8 min. The correlation coefficient R was 0.93. B, t-LTP = 37.7 ± 5.12 %, s-LTP = 57.3 ± 3.1 %, τ = 32.9 ± 11.1 min and R = 0.99. C, t-LTP = 52.7 ± 7.2 %, s-LTP = 20.5 ± 1.2 %, τ = 8.32 ± 1.5 min and R = 0.98. D, t-LTP = 70.3 ± 3.7 %, s-LTP = 56.7 ± 2.1 %, τ = 29.3 ± 3.6 min and R = 0.99.
Figure 8
Figure 8. Relationships between tetanisation and potentiation
A, relationship between Pmax, frequency of tetanisation and the number of induction stimuli. •, mean estimates from single experiments in the separate groups (error bars = s.e.m.). The grid shows the mean functional relationship between expression of potentiation and the induction parameters. The numbers of experiments per group were: 8 stimuli at 30–200 Hz (n = 8), 16 stimuli at 30 and 200 Hz (n = 6), 40 stimuli at 30-200 Hz (n = 8), 100 stimuli at 30-200 Hz (n = 6) and 200 stimuli at 30-200 Hz (n = 8). B, similar to A, showing that the amplitude of t-LTP is dependent on the frequency of tetanisation and independent of the number of stimuli given. C, the amplitude of s-LTP is dependent on the number of induction stimuli and independent of the frequency of tetanisation. D, decay time constants of t-LTP (τ) are related to the number of induction stimuli and independent of the frequency of tetanisation.
Figure 12
Figure 12. Paired-pulse facilitation in relation to the expression of transient and sustained LTP
A, experiments in which slices were tested with paired-pulse (PP) stimulation (n = 16) delivered once every 15 s with an inter-pulse interval (IPI) of 20 ms. The figure shows the mean potentiation of f-EPSP1 (•) and the mean facilitated potentiation of f-EPSP2 (▵). The filled arrow indicates the time of tetanisation. The amplitudes of potentiation of f-EPSP1 were: Pt0 = 102 ± 9.9 %, t-LTP = 62 ± 5.8 % and s-LTP = 39 ± 6.2 %. The τ of t-LTP was 18.7 ± 2.2 min. Averaged f-EPSPs from a single experiment are shown in the inset. B, a group of experiments in which t-LTP and s-LTP were tested with an IPI of 80 ms (n = 16). Pt0 = 124 ± 11.5 %, t-LTP = 76 ± 11.2 %, s-LTP = 48 ± 6.3 % and τ of t-LTP = 20.0 ± 2.5 min. C, the τ of t-LTP (•), in the IPI range from 5 to 500 ms, was not dependent on the amount of PPF in the control periods of the experiments (▵) and was greater when compared with the τ of t-LTP at 1/7.5 s (from Fig. 4A, indicated by the dashed line, P < 0.01, all cases). The τ of t-LTP in experiments in which PP stimulation was given with an IPI of 1000 ms, was similar to that of t-LTP at 1/7.5 s (P > 0.5). The numbers of experiments are indicated in parentheses. D, PPF (±s.e.m.) before and after tetanisation for the experimental groups in A (20 ms IPI, thick line) and B (80 ms IPI, thin line). When PP stimulation was given with an IPI of 20 ms the PPF was reduced from a pre-tetanic control value of 103 ± 9.4 % to 26 ± 4.9 % after the tetanisation (P < 0.0001, paired t test). It increased progressively to 80 ± 6.2 % over a period of 2 h and remained different from the control PPF (P < 0.01, paired t test). In PP experiments, in which IPI was 80 ms, the PPF decreased from a baseline value of 111 ± 7.0 % to 61 ± 4.8 % after tetanisation (P < 0.0001, paired t test). The PPF increased to 102 ± 8.1 % over a period of 2 h, and was not different from the control PPF (P = 0.4, paired t test).
Figure 13
Figure 13. Initial probability of neurotransmitter release and expression of transient and sustained LTP
A, Pmax was positively correlated (R = 0.980) to the amount of PPF in the control periods of the experiments. It was also linearly dependent on the amount of PPF (P < 0.02, ANOVA). B, t-LTP was positively correlated to the amount of PPF (R = 0.914), but not linearly dependent on the amount of PPF (P > 0.05, ANOVA). C, s-LTP was both positively correlated (R = 0.995) to the amount of PPF and linearly dependent on the amount of PPF (P < 0.01, ANOVA). D, the τ of t-LTP was neither correlated to PPF (R = 0.095) nor dependent on its amount (P > 0.9, ANOVA).
Figure 14
Figure 14. Effects of DL-AP5 on the decline of transient LTP
A, control experiments (n = 13) in which potentiation was tested 30 min after tetanisation (theta-burst, indicated by the filled arrow) using paired pulses (1/15 s, 80 ms IPI). • show potentiation of f-EPSP1, whereas the ▵ show the facilitated potentiation of f-EPSP2. Pt0 = 145 ± 13.3 %, t-LTP = 91 ± 8.4 %, s-LTP = 54 ± 11.5 % and τ of t-LTP = 16 ± 2.0 min. B, an experimental group (n = 12) which is similar to that in A, except that DL-AP5 (100 μM) was applied after the tetanisation as indicated by the bar. Pt0 = 98 ± 6.8 %, t-LTP = 44 ± 3.9 %, s-LTP = 54 ± 6.0 % and τ of t-LTP = 5.7 ± 1.1 min. C, effect of DL-AP5 (100 μM) on t-LTP, which was tested with single pulses, applied with a frequency of 1/15 s. Pt0 = 108 ± 8.9 %, t-LTP = 53 ± 3.7 %, s-LTP = 54 ± 6.4 % and τ of t-LTP = 11.3 ± 1.0 min. D, the amplitudes of Pt0 and t-LTP, tested with paired pulses in AP5 (B), were smaller (P < 0.01, both cases) than those of the control (A). s-LTP was similar to that of the control (P > 0.9). Amplitudes of Pt0, t-LTP and s-LTP, tested with single pulses (Fig. 3B), were similar to those seen after application of AP5 in the single-pulse experiments (C, P > 0.1, in all cases). E, decay time constants of t-LTP, for the experimental groups in D. The τ of t-LTP, after the application of AP5 (B) was smaller than that of the control (A, P < 0.0001). The τ of t-LTP, tested with single pulses in the AP5 experiments (C), was also smaller than that of the control (Fig. 3B, P < 0.05).
Figure 15
Figure 15. Decline of transient LTP is mediated by a decrease in the probability of neurotransmitter release
A, the mean input/output (i/o) relationship of responses to PP stimulation applied with an IPI of 80 ms (n = 16). Baseline responses were recorded at three times the threshold for evoking f-EPSPs. Responses were then sampled in the range from 1.5 to 10 times the threshold, in steps of 0.5 times the threshold. Data are presented as amplitudes of potentiation. • show the potentiation of f-EPSP1 and ▵ show the facilitated potentiation of f-EPSP2. The line shows the mean PPF ± s.e.m. Ba, after recording the baseline in standard medium, f-EPSPs were potentiated by a medium containing 2.5 mM Ca2+ and 1.5 mM Mg2+ (n = 16, 80 ms IPI). Bb, application of NBQX (0.33 μM), in a separate group of experiments, resulted in a decrease of the potentiated response. C, the relationship between the potentiation of f-EPSP1 and the facilitated potentiation of f-EPSP2 in the three conditions shown in A, Ba and Bb. The lines, as indicated in the top corner of the panel, show the fit of the data to the following function: Pf-EPSP2 = a + b × Pf-EPSP1 + c × (Pf-EPSP1)2. Thin lines show the confidence intervals of the fit. Regression coefficients are shown in the inset to the right. D, facilitated potentiation of f-EPSP2, from experiments in which t-LTP and s-LTP were tested either with (○, Fig. 14A) or without (•, Fig. 12B) a delay in the test stimulation, were plotted as the functions of the respective potentiations of the f-EPSP1 that were recorded in those experiments. The data were fitted to a polynomial function as in C. The calibration functions from C are superimposed on the data. E, the function that resulted from a change in the Ca2+:Mg2+ ratio was used to predict the facilitated potentiations of f-EPSP2 (lines) on the basis of the two potentiations of f-EPSP1 that were recorded in the experiments in which t-LTP and s-LTP were tested using PP stimulation (from Figs 12B and 14A). Circles show the two potentiations of f-EPSP2 that were recorded in those experiments. F, the three calibration functions, from the experiments presented in C were used to predict the amounts of facilitated potentiation of f-EPSP2 that were observed in PP stimulation experiments in which there was no delay in the post-tetanic control stimulation (Fig. 12B). The relative cumulative frequency distributions of the resulting single data sets, in the time period from 25 min to 1.5 h, are plotted against the relative cumulative occurrence of all data that were sorted in an ascending order by the amplitude of the facilitated potentiation of f-EPSP2. The heavy continuous line shows the distribution of the experimental data that have been plotted for comparison. The light line shows the distribution of f-EPSP2 which was predicted on the basis of the change in the Ca2+:Mg2+ ratio. The light dashed line shows the f-EPSP2 that was predicted on the basis of blockage of AMPA receptors. The heavy dashed line shows the f-EPSP2 that was predicted on the basis of the i/o relationship. G, recorded facilitated potentiation of f-EPSP2 (heavy continuous line) from experiments in which t-LTP and s-LTP were tested with a delay in PP stimulation (Fig. 14A). Other lines represent the three corresponding predictions of f-EPSP2. Data are plotted in a similar manner as in F.
Figure 16
Figure 16. Modulation of t-LTP and LTP by burst activity
A, after a control period (PP stimulation, IPI = 80 ms, n = 16) the slices were tetanised (theta-burst, filled arrow). Subsequently, a paired-pulse and burst protocol (PPB) was given at intervals of 1/15 s. The PPB consisted of a stimulus that was 80 ms later followed by a burst (four stimuli at 200 Hz, see inset). PPB stimulation was applied for 30 min (indicated by horizontal bar) and was followed by PP stimulation, which was used to test the expression of potentiation. •, potentiation of f-EPSP1 and ▵ facilitated potentiation of f-EPSP2. Pt0 = 144 ± 16.0 %, t-LTP = 92 ± 13 %, s-LTP = 53 ± 7.7 % and τ of t-LTP 19 ± 3.2 min. B, similar to the experiments in A, except that PPB stimulation consisted of a single pulse that was followed by a burst at a frequency of 30 Hz (n = 16). Pt0 = 80 ± 7.2 %, t-LTP = 46 ± 6.1 %, s-LTP = 34 ± 6.8 % and τ of t-LTP = 18 ± 2.1 min. C, PP experiments (IPI = 80 ms, n = 10) show the effect of five subsequent tetanisations (indicated by the arrows, spaced by 7 min). The tetani were interposed (indicated by the bars) by high frequency PPB stimulation (200 Hz) that was given once every 15 s. Pt0 = 131 ± 16.9 %, t-LTP = 77 ± 8.7 %, s-LTP = 54 ± 10.1 % and τ of t-LTP 24 ± 2.6 min. D, PP experiments that are similar to the experiments in C except that PPB stimulation was omitted (n = 10). Note the difference in the y axis scaling also. Pt0 = 240 ± 25.0 %, t-LTP = 155 ± 22.1 %, s-LTP = 85 ± 10.4 % and τ of t-LTP 19 ± 1.4 min. E, experiments that are similar to those in A, except that DL-AP5 (100 μM, indicated by the dashed line, n = 11) was applied together with the high frequency PPB stimulation (indicated by the horizontal bar). Pt0 = 118 ± 8.7 %, t-LTP = 32 ± 3.5 %, s-LTP = 87 ± 7.7 % and τ of t-LTP = 8.6 ± 2.7 min. F, the amplitudes of Pt0, t-LTP and s-LTP from the standard PP experiments (Fig. 12B) were compared with those in A, B, C, D and E. Potentiations that were reached with theta-burst stimulation and PPB in A (A) were not different from the controls (P > 0.3, in all cases). In the experiments in which 30 Hz PPB was used (B), Pt0 and t-LTP were smaller (P < 0.05, both cases) and s-LTP was not different (P > 0.1) when compared with those of the control. The potentiations in experiments in which five tetanisations were interposed with PPB stimulations (C) were similar to those of the control (P ≥ 0.6, in all cases). Five tetanisations without PPB stimulation (D) resulted in greater amplitudes of potentiation when compared with the controls (P < 0.01, in all cases). The t-LTP that was observed after PPB stimulation in AP5 (E) was reduced (P < 0.01) while the s-LTP was upregulated (P < 0.001) without a change in the Pt0 (P > 0.7) when compared with those of the control. G, decay times for the experimental groups in F. t-LTP in the AP5 experiments (E) decayed faster when compared with that of the control (P < 0.01).
Figure 17
Figure 17. Induction of t-LTP and LTP by PPB stimulation
A, experiments in which potentiation was induced by PPB stimulation (IPI = 80 ms, burst = 4 stimuli at 200 Hz, indicated by horizontal bar) that was applied once every 15 s for a period of 30 min (n = 16). PP stimulation (IPI = 80 ms, 1/15 s) was used both in the control and in the test periods of the experiments. •, potentiation of f-EPSP1, ▵ potentiation of f-EPSP2. Pt0 = 227 ± 25.8 %, t-LTP = 147 ± 23.2 %, s-LTP = 80 ± 7.3 % and τ of t-LTP = 26 ± 2.2 min. B, experimental situation similar to that shown in A, but the burst frequency was 30 Hz (n = 16). Pt0 = 63 ± 15.9 %, t-LTP = 57 ± 13.3 %, s-LTP = 6 ± 7.9 % and τ of t-LTP = 22 ± 4.6 min. C, 100 μM DL-AP5 was present throughout the recording time (indicated by the dashed line) in a group of experiments (n = 16) that were otherwise similar to those shown in A. Application of high frequency PPB stimulation (horizontal bar) caused a small potentiation of the f-EPSPs (18 ± 4.3 %), which decayed to a potentiation of −5 ± 5.7 % with a τ value of 4.0 ± 0.8 min. D, potentiations (Pt0, t-LTP and s-LTP), induced by theta-burst stimulation in the experiments tested with paired pulses (Fig. 12B) were compared with those induced by PPB stimulation in the experiments shown in A, B and C. Induction with PPB stimulation at 200 Hz resulted in larger amplitudes of Pt0, t-LTP and s-LTP when compared with the controls (P < 0.01, in all cases). Differently, PPB stimulation at 30 Hz resulted in smaller amplitudes of Pt0 and s-LTP when compared with those of the control (P < 0.01, in both cases). However, t-LTP was similar to that of the control (P > 0.2). The induction of potentiation was blocked by DL-AP5 (P < 0.0001, in all cases). E, the decay time constants of t-LTP for the experimental groups shown in D. Decay time constants in AP5 were smaller than those observed in other experiments (P < 0.0001).
Figure 18
Figure 18. Transient LTP as a basis for dynamic modulation of synaptic transmission
A, a non-potentiated synapse. The efficacies of this and following synapses are depicted at the top of the respective synapses in terms of the input/output relationships of the numbers of presynaptic action potentials and the corresponding numbers and amplitudes of EPSPs. The black arrows in the synapse indicate the hypothetical pathway that involves the production of a retrograde messenger (Rm) and leads to an upregulation of the probability of neurotransmitter release (PR). Red arrows show the second messenger (Sm) pathway that leads to an upregulation of AMPA receptor conductance (gAMPA). Potentiation can be induced by activation of each of the two pathways, depending on the potency of synaptic events. The ability of the synaptic events to either induce or reduce potentiation is depicted by the activity arrows, which correspond in their colour to the activity scale at the right top corner of the figure. B, a synapse in which t-LTP was induced presynaptically by an increase in PR (depicted by an increase in the numbers of docked vesicles). C, t-LTP and two forms of s-LTP can be induced by a potent synaptic activation. s-LTP can be expressed both presynaptically (presynaptic phosphorylation) and postsynaptically (phosphorylation and externalisation of AMPA receptors). D, usage of t-LTP by a sparse synaptic activation leads to a state in which only s-LTP is present.

Similar articles

Cited by

References

    1. Abel T, Nguyen PV, Barad M, Deuel TA, Kandel ER, Bourtchouladze R. Genetic demonstration of a role for PKA in the late phase of LTP and in hippocampus-based long-term memory. Cell. 1997;88:615–626. - PubMed
    1. Albright TD, Jessell TM, Kandel ER, Posner MI. Neural science: a century of progress and the mysteries that remain. Cell. 2000;100:S1–55. - PubMed
    1. Andersen P, Sundberg SH, Sveen O, Swann JW, Wigstrom H. Possible mechanisms for long-lasting potentiation of synaptic transmission in hippocampal slices from guinea-pigs. J Physiol. 1980;302:463–482. - PMC - PubMed
    1. Andreasen M, Lambert JD, Jensen MS. Effects of new non-N-methyl-D-aspartate antagonists on synaptic transmission in the in vitro rat hippocampus. J Physiol. 1989;414:317–336. - PMC - PubMed
    1. Antonova I, Arancio O, Trillat AC, Wang HG, Zablow L, Udo H, Kandel ER, Hawkins RD. Rapid increase in clusters of presynaptic proteins at onset of long-lasting potentiation. Science. 2001;294:1547–1550. - PubMed

Publication types

MeSH terms

LinkOut - more resources