Comparative Study
. 2003 Jun 9:4:24.
doi: 10.1186/1471-2105-4-24. Epub 2003 Jun 9.

A data review and re-assessment of ovarian cancer serum proteomic profiling

Affiliations
Comparative Study

A data review and re-assessment of ovarian cancer serum proteomic profiling

James M Sorace et al. BMC Bioinformatics. .

Abstract

Background: The early detection of ovarian cancer has the potential to dramatically reduce mortality. Recently, the use of mass spectrometry to develop profiles of patient serum proteins, combined with advanced data mining algorithms has been reported as a promising method to achieve this goal. In this report, we analyze the Ovarian Dataset 8-7-02 downloaded from the Clinical Proteomics Program Databank website, using nonparametric statistics and stepwise discriminant analysis to develop rules to diagnose patients, as well as to understand general patterns in the data that may guide future research.

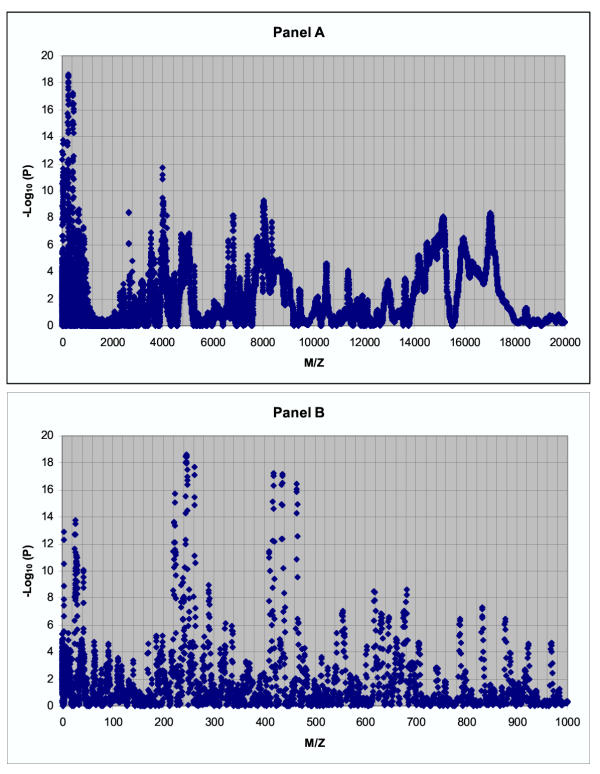
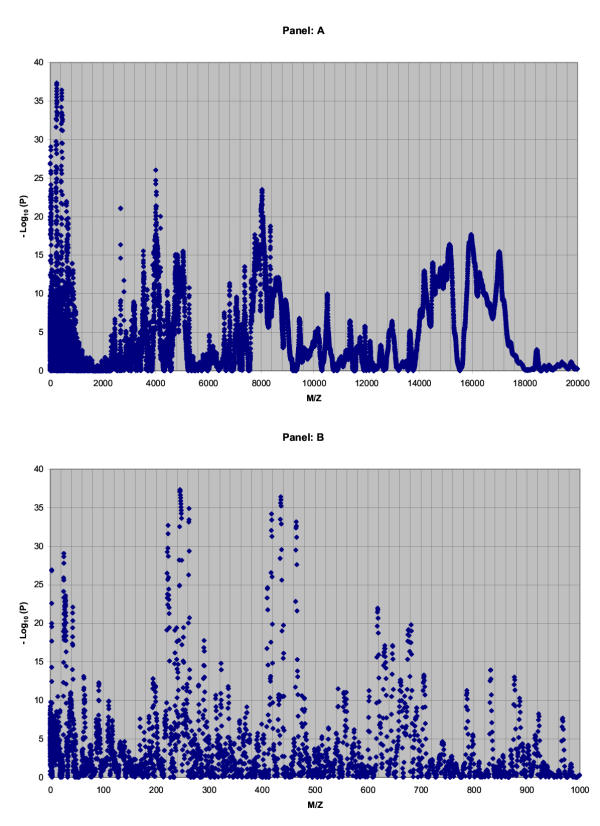
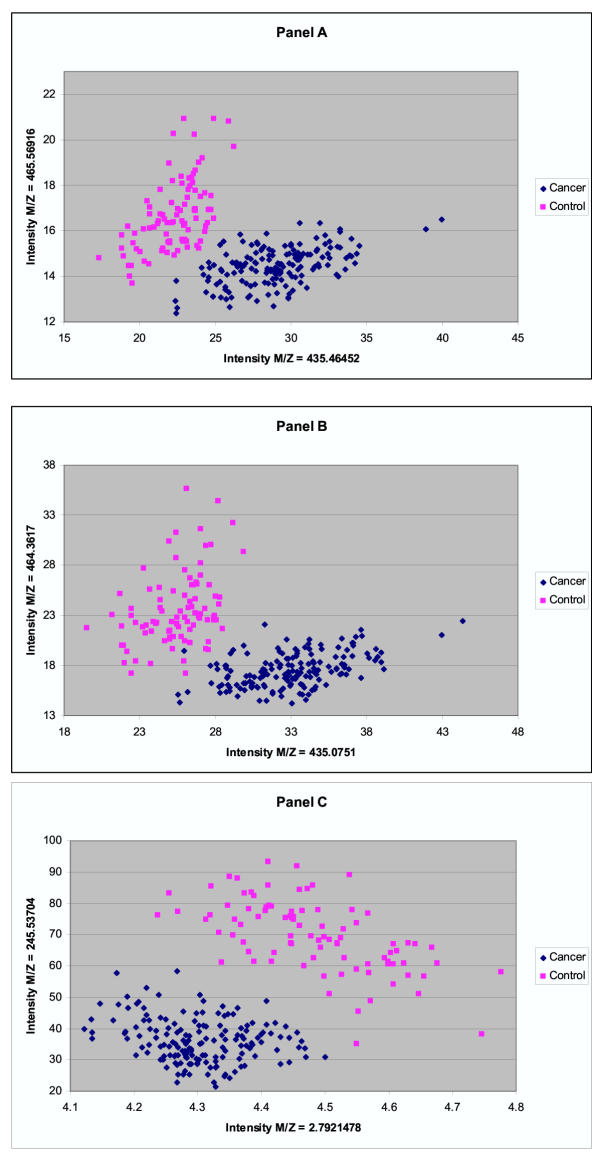
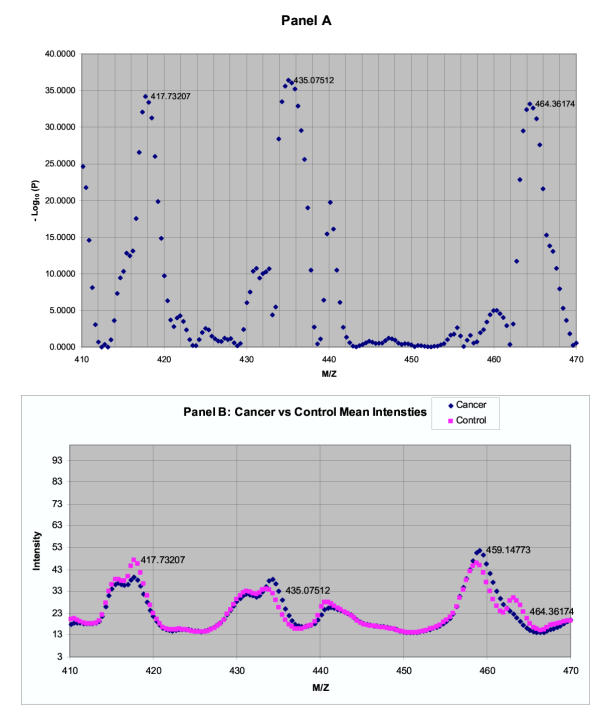
Results: The mass spectrometry serum profiles derived from cancer and controls exhibited numerous statistical differences. For example, use of the Wilcoxon test in comparing the intensity at each of the 15,154 mass to charge (M/Z) values between the cancer and controls, resulted in the detection of 3,591 M/Z values whose intensities differed by a p-value of 10-6 or less. The region containing the M/Z values of greatest statistical difference between cancer and controls occurred at M/Z values less than 500. For example the M/Z values of 2.7921478 and 245.53704 could be used to significantly separate the cancer from control groups. Three other sets of M/Z values were developed using a training set that could distinguish between cancer and control subjects in a test set with 100% sensitivity and specificity.

Conclusion: The ability to discriminate between cancer and control subjects based on the M/Z values of 2.7921478 and 245.53704 reveals the existence of a significant non-biologic experimental bias between these two groups. This bias may invalidate attempts to use this dataset to find patterns of reproducible diagnostic value. To minimize false discovery, results using mass spectrometry and data mining algorithms should be carefully reviewed and benchmarked with routine statistical methods.


Figures

Figure 1
Figure 1
Training Set Wilcoxon p-values by M/Z value. Wilcoxon p-values between normal and cancer members of the training set were calculated for every M/Z value. The Y axis represents negative the Log (base 10) of the p-value. Panel A: The X axis represents M/Z values between 0 and 20,000. Panel B: The X axis represents M/Z values between 0 and 1000. The following control spectra were used for the initial training set: daf-0181 daf-0182 daf-0183 daf-0188 daf-0189 daf-0192 daf-0193 daf-0195 daf-0196 daf-0197 daf-0198 daf-0200 daf-0201 daf-0202 daf-0205 daf-0207 daf-0210 daf-0211 daf-0212 daf-0217 daf-0218 daf-0220 daf-0223 daf-0226 daf-0230 daf-0234 daf-0235 daf-0241 daf-0242 daf-0244 daf-0247 daf-0248 daf-0250 daf-0251 daf-0252 daf-0258 daf-0259 daf-0261 daf-0262 daf-0263 daf-0267 daf-0269 daf-0270 daf-0279 daf-0280 The following cancer spectra were used for the initial training set. daf-0601 daf-0602 daf-0606 daf-0608 daf-0609 daf-0612 daf-0617 daf-0618 daf-0619 daf-0620 daf-0621 daf-0625 daf-0627 daf-0632 daf-0633 daf-0634 daf-0635 daf-0636 daf-0643 daf-0644 daf-0651 daf-0654 daf-0655 daf-0656 daf-0657 daf-0661 daf-0662 daf-0663 daf-0664 daf-0666 daf-0667 daf-0669 daf-0673 daf-0675 daf-0682 daf-0683 daf-0687 daf-0688 daf-0691 daf-0692 daf-0697 daf-0698 daf-0701 daf-0702 daf-0703 daf-0705 daf-0706 daf-0707 daf-0708 daf-0709 daf-0716 daf-0718 daf-0719 daf-0726 daf-0727 daf-0729 daf-0731 daf-0733 daf-0735 daf-0737 daf-0740 daf-0744 daf-0751 daf-0752 daf-0753 daf-0754 daf-0755 daf-0756 daf-0757 daf-0758 daf-0760 daf-0761 daf-0762 daf-0764 daf-0768 daf-0770 daf-0773 daf-0776 daf-0778 daf-0780
Figure 2
Figure 2
Wilcoxon P-Values by M/Z Value for Entire Dataset .Wilcoxon p-values between normal and cancer members of the entire dataset set were calculated for every M/Z value. The Y axis in negative the Log base 10 of the p-value. Panel A: the x-axis represents M/Z from 0 to 20,000. Panel B: the x-axis represents M/Z from 0 to 1,000.
Figure 3
Figure 3
Diagnostic value of Low M/Z values. Scatter plots of the 162 cancer subject versus 91 normal subjects. Panel A represents 2 M/Z values from the Clinical Proteomics Program Database while Panel B and Panel C are both derived from Rule 1. See text for details.
Figure 4
Figure 4
P-values and Intensities for M/Z values between 410 and 470. The p-values and mean intensities of cancer and control groups (entire set) for M/Z values between 410 and 470 are shown in panels A and B respectively. Selected data points are labelled with their M/Z values directly to the right of the points, see text for details.

References

    1. Michener CM, Ardekani AM, Petricoin EF, 3rd, Liotta LA, Kohn EC. Genomics and proteomics: application of novel technology to early detection and prevention of cancer. Cancer Detect Prev. 2002;26:249–255. doi: 10.1016/S0361-090X(02)00092-2. - DOI - PubMed
    1. Petricoin EF, Zoon KC, Kohn EC, Barrett JC, Liotta LA. Clinical proteomics: translating benchside promise into bedside reality. Nat Rev Drug Discov. 2002;1:683–695. doi: 10.1038/nrd891. - DOI - PubMed
    1. Srinivas PR, Verma M, Zhao Y, Srivastava S. Proteomics for cancer biomarker discovery. Clin Chem. 2002;48:1160–1169. - PubMed
    1. Herrmann PC, Liotta LA, Petricoin EF., 3rd Cancer proteomics: the state of the art. Dis Markers. 2001;17:49–57. - PMC - PubMed
    1. Clinical Proteomics Data Bank http://clinicalproteomics.steem.com/ppatterns.php

Publication types

MeSH terms