. 2003 Jun 9;161(5):845-51.
doi: 10.1083/jcb.200303082.

Regulation of leading edge microtubule and actin dynamics downstream of Rac1

Affiliations

Regulation of leading edge microtubule and actin dynamics downstream of Rac1

Torsten Wittmann et al. J Cell Biol. .

Abstract

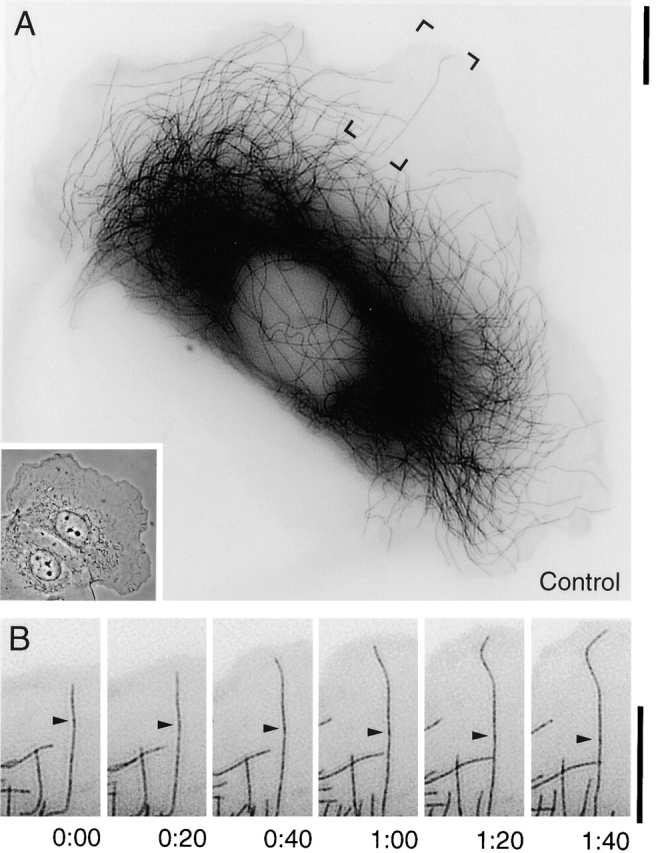
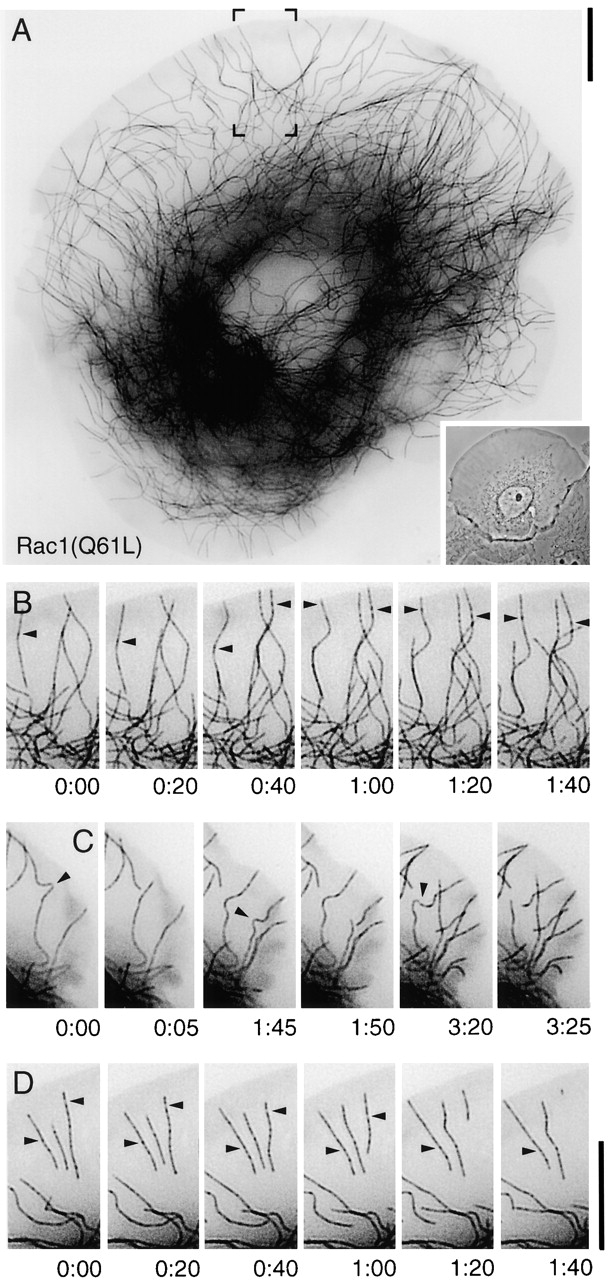
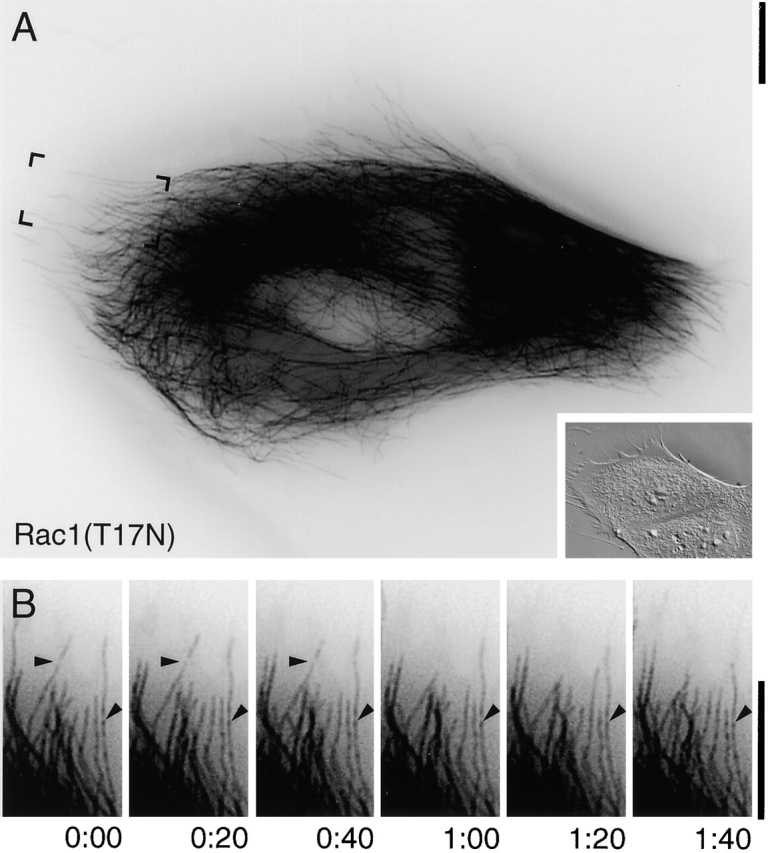
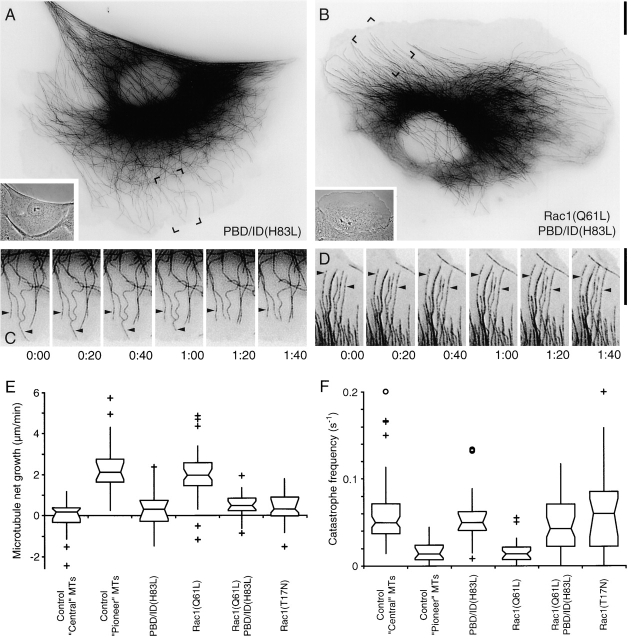
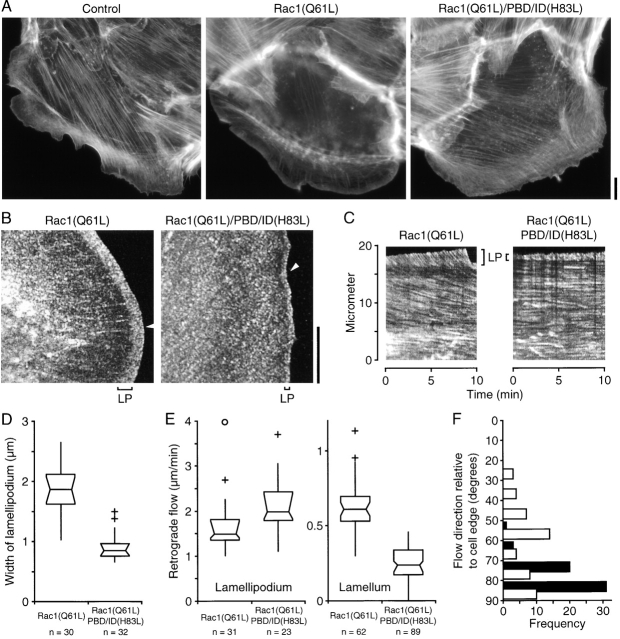
Actin in migrating cells is regulated by Rho GTPases. However, Rho proteins might also affect microtubules (MTs). Here, we used time-lapse microscopy of PtK1 cells to examine MT regulation downstream of Rac1. In these cells, "pioneer" MTs growing into leading-edge protrusions exhibited a decreased catastrophe frequency and an increased time in growth as compared with MTs further from the leading edge. Constitutively active Rac1(Q61L) promoted pioneer behavior in most MTs, whereas dominant-negative Rac1(T17N) eliminated pioneer MTs, indicating that Rac1 is a regulator of MT dynamics in vivo. Rac1(Q61L) also enhanced MT turnover through stimulation of MT retrograde flow and breakage. Inhibition of p21-activated kinases (Paks), downstream effectors of Rac1, inhibited Rac1(Q61L)-induced MT growth and retrograde flow. In addition, Rac1(Q61L) promoted lamellipodial actin polymerization and Pak-dependent retrograde flow. Together, these results indicate coordinated regulation of the two cytoskeletal systems in the leading edge of migrating cells.


Figures

Figure 1.
Figure 1.
MT dynamics in a PtK1 cell. (A) MTs in a control PtK1 cell visualized by microinjected X-rhodamine tubulin and fluorescence microscopy (Video 1). Inset: phase contrast image of the same cell. (B) Dynamic behavior of MTs in the boxed area in A. A pioneer MT exhibits extensive plus end growth during protrusion of the leading edge. Arrow, fiduciary mark on the MT. Elapsed time, min:sec. Bars, 10 μm.
Figure 2.
Figure 2.
Constitutively active Rac1(Q61L) promotes MT growth at cell edges. (A) MTs in a PtK1 cell expressing constitutively active Rac1(Q61L) (Video 2). Inset: phase contrast image of the same cell. (B) Dynamic behavior of MTs in the boxed area in A. Although MT plus ends at the edge of Rac1(Q61L)-expressing cells often appear stationary, the constant rearward flow of fiduciary marks on the MT lattices (arrows) reveals that they are actively growing. (C) MTs buckle and break (arrows) as a result of retrograde flow in Rac1(Q61L)-expressing cells. (D) Treadmilling of MT fragments in a Rac1(Q61L)-expressing cell. Fragments eventually depolymerize by minus-end shortening (Video 5). Arrows indicate fiduciary marks on MTs. Elapsed time, min:sec. Bars, 10 μm.
Figure 3.
Figure 3.
Dominant-negative Rac1(T17N) eliminates pioneer MT behavior. (A) MTs in a PtK1 cell expressing dominant-negative Rac1(T17N) (Video 3). Inset: differential interference contrast image of the same cell. (B) Dynamic behavior of MTs in the boxed area in A. MTs do not undergo retrograde flow and frequently transition between growth and shortening phases. Arrows, fiduciary marks on MTs. Elapsed time, min:sec. Bars, 10 μm.
Figure 4.
Figure 4.
Pak inhibition blocks Rac1(Q61L)-mediated MT growth. (A) MTs in a PtK1 cell injected with the Pak1 inhibitory fragment PBD/ID(H83L) (120 μM needle concentration) and X-rhodamine tubulin (Video 6). Note that the boxed area represents a flat region underneath a neighboring cell. (B) MTs in a Rac1(Q61L)-expressing PBD/ID(H83L)-injected PtK1 cell (Video 7). Insets: phase contrast images of the cells in A and B. (C) Dynamic behavior of MTs in the boxed area in A. MTs grow very little and do not exhibit retrograde flow in PBD/ID(H83L)-injected cells. (D) Dynamic behavior of MTs in the boxed area in B. In Rac1(Q61L)-expressing PBD/ID(H83L)-injected cells, retrograde MT flow is severely reduced and MTs grow very little. Arrows, fiduciary marks on MTs. Elapsed time, min:sec. Bars, 10 μm. (E, F) Statistical evaluation of MT net growth (E) and catastrophe frequency (F) of individual MTs (from Table I). Net MT growth is significantly reduced and the catastrophe frequency increased in cells expressing Rac1(T17N) or injected with the Pak1 inhibitory fragment as compared with pioneer MTs or MTs in Rac1(Q61L)-expressing cells (P < 0.01 by ANOVA). Data in this and the next figure are presented as box-and-whisker plots indicating the 25th percentile (bottom boundary), median (middle line), 75th percentile (top boundary), nearest observations within 1.5 times the interquartile range (whiskers), 95% confidence interval of the median (notches), and near (+) and far (○) outliers.
Figure 5.
Figure 5.
Pak inhibition blocks Rac1(Q61L)-induced actin dynamics. (A) Control, Rac1(Q61L)-, and Rac1(Q61L)-expressing PtK1 cells injected with PBD/ID(H83L) were fixed and stained with fluorescent phalloidin. Pak inhibition blocks Rac1(Q61L)-induced concentration of actin in the lamellipodium and promotes the formation of parallel actin bundles in the cell body. (B) Single frames of actin fluorescent speckle time-lapse series of Rac1(Q61L)-expressing cells injected with GST or PBD/ID(H83L) (Videos 8 and 9). LP, lamellipodium. Bars, 10 μm. (C) Kymograph analysis of actin retrograde flow in the cells in B along the lines indicated by arrowheads. Streaks on kymographs indicate speckle position over time; steeper streaks = faster flow rate. (D) Width of the lamellipodium in Rac1(Q61L)-expressing cells and PBD/ID(H83L)-injected, Rac1(Q61L)-expressing cells measured in fixed, phalloidin-stained cells. Inhibition of Pak downstream of Rac1 reduces the lamellipodium width. n, number of cells analyzed. (E) Rate of actin retrograde flow in the lamellipodium and lamellum in Rac1(Q61L)- expressing cells and PBD/ID(H83L)-injected, Rac1(Q61L)-expressing cells. Inhibition of Pak reduces the rate of flow in the lamellum but not the lamellipodium. n, number of measurements from kymographs in 10 cells. (F) Histogram of the direction of lamella actin flow relative to the cell edge in Rac1(Q61L)-expressing cells (solid bars) and PBD/ID(H83L)-injected, Rac1(Q61L)-expressing cells (open bars). Actin retrograde flow is predominantly perpendicular to the edge in Rac1(Q61L)-expressing cells but residual flow is randomized on Pak inhibition.

References

    1. Adams, M.C., W.C. Salmon, S.L. Gupton, C.S. Cohan, T. Wittmann, N. Prigozhina, and C.M. Waterman-Storer. 2003. A high-speed multispectral spinning-disk confocal microscope system for fluorescent speckle microscopy of living cells. Methods. 29:29–41. - PubMed
    1. Ballestrem, C., B. Wehrle-Haller, B. Hinz, and B.A. Imhof. 2000. Actin-dependent lamellipodia formation and microtubule-dependent tail retraction control directed cell migration. Mol. Biol. Cell. 11:2999–3012. - PMC - PubMed
    1. Bokoch, G.M. 2003. Biology of the p21-activated kinases. Annu. Rev. Biochem. 72:743–781. - PubMed
    1. Daub, H., K. Gevaert, J. Vandekerckhove, A. Sobel, and A. Hall. 2001. Rac/Cdc42 and p65PAK regulate the microtubule-destabilizing protein stathmin through phosphorylation at serine 16. J. Biol. Chem. 276:1677–1680. - PubMed
    1. Desai, A., and T.J. Mitchison. 1997. Microtubule polymerization dynamics. Annu. Rev. Cell Dev. Biol. 13:83–117. - PubMed

Publication types

MeSH terms