. 2003 Jun 9;161(5):957-67.
doi: 10.1083/jcb.200301101.

A novel mechanism of myocyte degeneration involving the Ca2+-permeable growth factor-regulated channel

Affiliations

A novel mechanism of myocyte degeneration involving the Ca2+-permeable growth factor-regulated channel

Yuko Iwata et al. J Cell Biol. .

Abstract

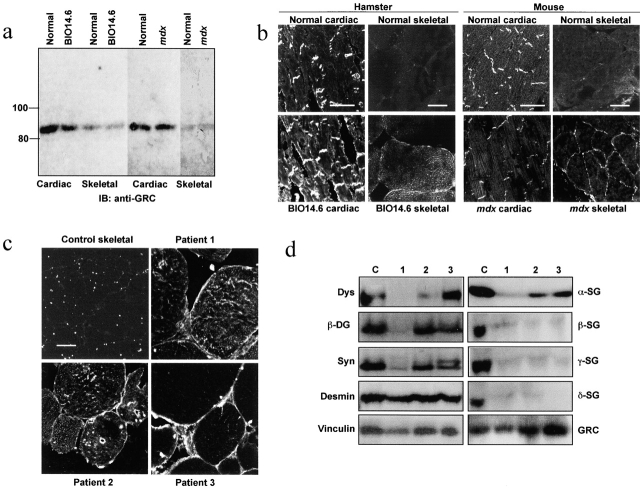
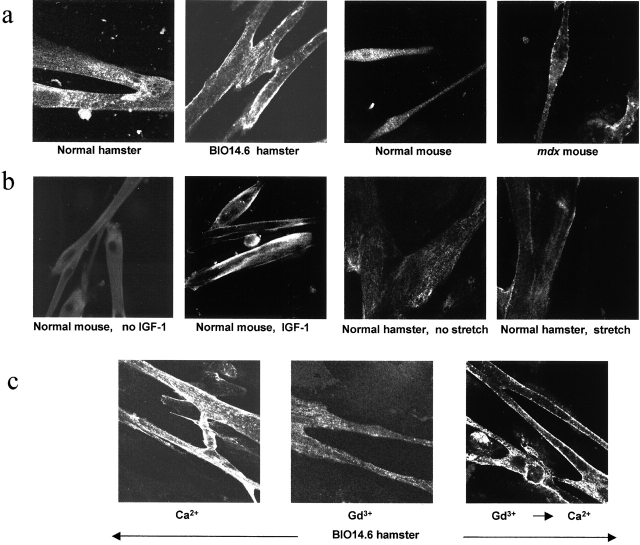
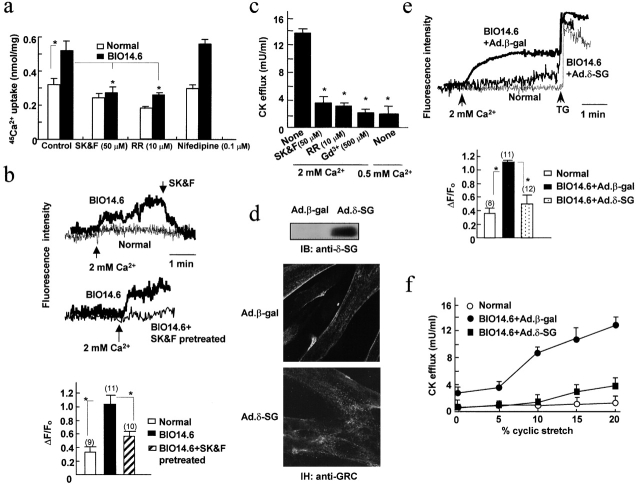
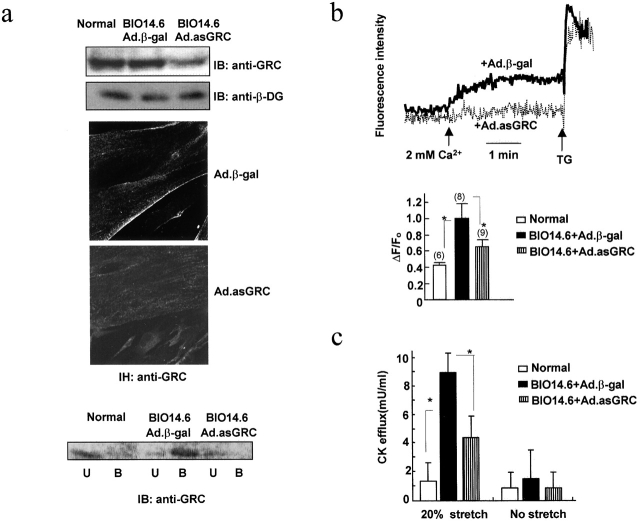
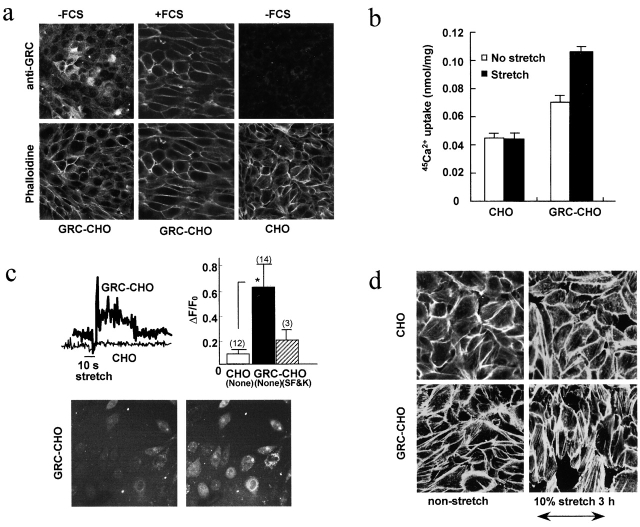
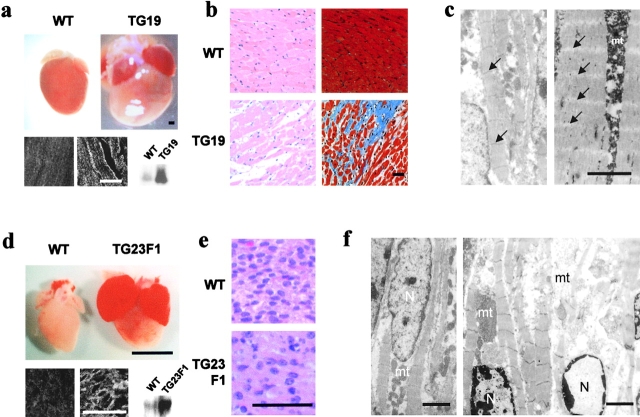
Disruption of the dystrophin-glycoprotein complex caused by genetic defects of dystrophin or sarcoglycans results in muscular dystrophy and/or cardiomyopathy in humans and animal models. However, the key early molecular events leading to myocyte degeneration remain elusive. Here, we observed that the growth factor-regulated channel (GRC), which belongs to the transient receptor potential channel family, is elevated in the sarcolemma of skeletal and/or cardiac muscle in dystrophic human patients and animal models deficient in dystrophin or delta-sarcoglycan. However, total cell GRC does not differ markedly between normal and dystrophic muscles. Analysis of the properties of myotubes prepared from delta-sarcoglycan-deficient BIO14.6 hamsters revealed that GRC is activated in response to myocyte stretch and is responsible for enhanced Ca2+ influx and resultant cell damage as measured by creatine phosphokinase efflux. We found that cell stretch increases GRC translocation to the sarcolemma, which requires entry of external Ca2+. Consistent with these findings, cardiac-specific expression of GRC in a transgenic mouse model produced cardiomyopathy due to Ca2+ overloading, with disease expression roughly parallel to sarcolemmal GRC levels. The results suggest that GRC is a key player in the pathogenesis of myocyte degeneration caused by dystrophin-glycoprotein complex disruption.


Figures

Figure 1.
Figure 1.
Expression of GRC in dystrophic muscles. (a) Contents of GRC protein in cardiac and skeletal muscles from BIO14.6 hamster, mdx mouse, and normal controls. Muscle homogenates (40 μg per lane) were subjected to immunoblot assay with anti-GRC. (b and c) Immunohistochemical localization of GRC in frozen sections of cardiac and skeletal muscles from normal and dystrophic animals and skeletal muscles from dystrophic patients and a nondystrophic control. Bars, 50 μm. (d) Immunoblot analysis of skeletal muscle homogenates from dystrophic patients and a nondystrophic control using antibodies against the indicated proteins. Samples correspond to those in c. Dys, dystrophin; SG, sarcoglycan; DG, dystroglycan; Syn, syntrophin.
Figure 2.
Figure 2.
GRC translocation in normal and dystrophic myotubes. (a) Immunohistochemical localization of GRC protein in myotubes from BIO14.6 hamster and mdx mouse. (b) Effect of IGF-1 treatment or cyclic cell stretch on GRC translocation in normal mouse and hamster myotubes. (c) Ca2+-induced shift of GRC localization in BIO14.6 myotubes. Myotubes initially placed in 2 mM Ca2+ were transferred to medium containing 0.5 mM Gd3+, and 1 h later were transferred back to 2 mM Ca2+.
Figure 3.
Figure 3.
Increased Ca 2+ influx into and CK efflux from BIO14.6 myotubes and their correction by δ-SG gene transfer. (a) 45Ca2+ uptake into normal or BIO14.6 myotubes measured under resting conditions with or without SK&F96365 (SK&F), ruthenium red (RR), or Nifedipine. The Gd3+-inhibitable fractions are shown. (b) External Ca2+-induced changes in fluo-4 fluorescence in normal or BIO14.6 myotubes. The bar graph shows the maximal increments of fluorescence in myotubes pretreated with or without 50 μM SK&F96365. ΔF/F0 is the ratio between the fluorescence increment and the fluorescence before Ca2+ addition. Numbers in parentheses correspond to the number of cells studied. (c) CK efflux from BIO14.6 myotubes subjected to cyclic stretch under indicated conditions. (d) Immunoblot assay and immunohistochemistry (IH) of BIO14.6 myotubes infected with Ad.β-gal or Ad.δ-SG. (e and f) External Ca2+-induced changes in fluo-4 fluorescence and cyclic stretch–induced CK efflux in BIO14.6 myotubes insfected with Ad.β-gal or Ad.δ-SG. TG, thapsigargin (1 μM). Other conditions were similar to b and c. In these panels, error bars show means ± SD and asterisks show P < 0.05.
Figure 4.
Figure 4.
Effect of GRC antisense expression on BIO14.6 myotubes. (a) Immunoblot assay for GRC and β-dystroglycan (β-DG; top) and GRC immunohistochemistry (middle) of BIO14.6 myotubes infected with Ad.β-gal or Ad-antisense–GRC cDNA (Ad.asGRC). Cell surface GRC levels were estimated by labeling antisense-treated or nontreated myotubes with NHS-biotin and by further analyzing streptavidin agarose-bound (B) and -unbound (U) fractions by immunoblot assay with anti-GRC (bottom). (b and c) External Ca2+-induced changes in fluo-4 fluorescence and cyclic stretch-induced CK efflux from antisense-treated or nontreated myotubes. Other conditions were the same as those in Fig. 3 (b and c). Error bars show means ± SD and asterisks show P < 0.05.
Figure 5.
Figure 5.
Characterization of CHO cells expressing GRC. (a) Effect of FCS on GRC localization in CHO cells serum-starved for 24 h. Cells were stained with anti-GRC or rhodamine-phalloidin. (b) Gd3+-inhibitable 45Ca2+ uptake into GRC-transfected or nontransfected cells measured for 5 min with cyclic stretch applied for 3 min starting from the end of the first min. (c) Stretch–induced changes in [Ca2+]i as monitored by the fluo-4 fluorescence. The maximal increments of fluorescence are shown in the bar graph (mean ± SD). Microscopic fields before and after stretch showing low and elevated levels of fluorescence in GRC-expressing cells (bottom). Data represent a typical result from four similar experiments. (d) Effect of uniaxial cyclic stretch on the cell orienting response. Rhodamine-phalloidin–stained images of nonstretched and stretched cells are shown. In b and c, error bars show means ± SD and asterisks show P < 0.05.
Figure 6.
Figure 6.
Histological analysis of GRC overexpressing transgenic hearts. (a) Hearts were excised from 120-d-old nontransgenic (WT) and transgenic (TG19 founder line) mice. (heart) Bar, 1 mm. (bottom) Immunoblot and immunohistochemical analyses of GRC protein in WT and TG19 ventricles. For the latter analysis, paraffin sections were used (left, WT; right, TG19). (b) Sections of heart from WT and TG19 mice stained with hematoxylin and eosin (left) or Masson's trichrome (right). (c) Ultrastructural analysis of WT (left) and TG19 (right) ventricles. Z-lines are lost in TG19 (arrows). (d) Hearts excised from 1-d-old nontransgenic (WT) and transgenic (TG23F1) mice. (heart) Bar, 1 mm. (bottom) Immunoblot and immunohistochemical analyses of GRC protein in WT and TG23F1 ventricles. For the latter analysis, paraffin sections were used (left, WT; right, TG23F1). (e) Sections of ventricles from WT and TG23F1 mice stained with hematoxylin and eosin. (f) Ultrastructural analysis of WT (left) and TG23F1 (right) ventricles. Bars: (light microscopy) 50 μm; (EM) 2 μm. mt and N denote mitochondria and nuclei, respectively.

Similar articles

Cited by

References

    1. Alderton, J.M., and R.A. Steinhardt. 2000. a. Calcium influx through calcium leak channels is responsible for the elevated levels of calcium-dependent proteolysis in dystrophic myotubes. J. Biol. Chem. 275:9452–9460. - PubMed
    1. Alderton, J.M., and R.A. Steinhardt. 2000. b. How calcium influx through calcium leak channels is responsible for the elevated levels of calcium-dependent proteolysis in dystrophic myotubes. Trends Cardiovasc Med. 10:268–272. - PubMed
    1. Bajusz, E., F. Homburger, J.R. Baker, and P. Bogdonoff. 1969. Dissociation of factors influencing myocardial degeneration and generalized cardiocirculatory failure. Ann. NY Acad. Sci. 156:396–420. - PubMed
    1. Barton, E.R., L. Morris, A. Musarao, N. Rosenthal, and H.L. Sweeney. 2002. Muscle-specific expression of insulin-like growth factor 1 counters muscle decline in mdx mice. J. Cell Biol. 157:137–147. - PMC - PubMed
    1. Bertrand, B., S. Wakabayashi, S. Ikeda, J. Pouysségur, and M. Shigekawa. 1994. The Na+/H+ exchanger isoform 1 (NHE1) is a novel member of the calmodulin-binding proteins. Identification and characterization of calmodulin-binding sites. J. Biol. Chem. 269:13703–13709. - PubMed

Publication types

MeSH terms