. 2003 Dec;4(4):521-40.
doi: 10.1007/s10162-002-3037-3. Epub 2003 Jun 13.

Medial olivocochlear efferent reflex in humans: otoacoustic emission (OAE) measurement issues and the advantages of stimulus frequency OAEs

Affiliations

Medial olivocochlear efferent reflex in humans: otoacoustic emission (OAE) measurement issues and the advantages of stimulus frequency OAEs

John J Guinan Jr et al. J Assoc Res Otolaryngol. 2003 Dec.

Abstract

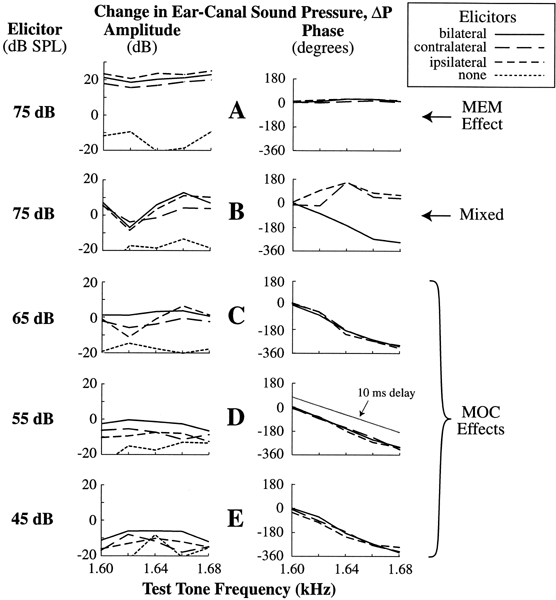
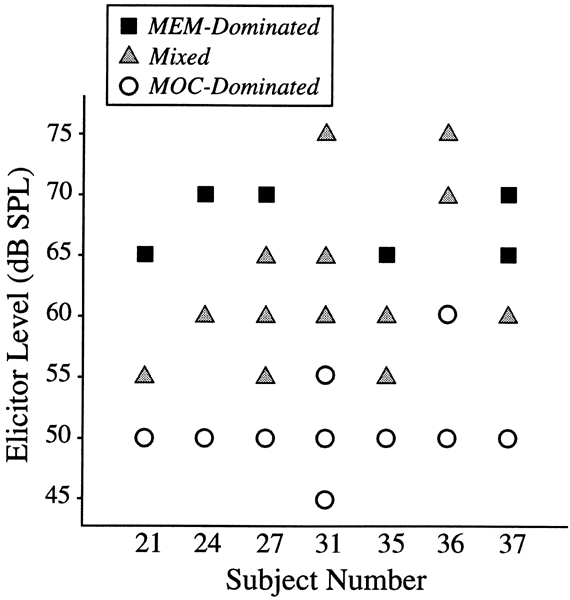
Otoacoustic emissions (OAEs) are useful for studying medial olivocochlear (MOC) efferents, but several unresolved methodological issues cloud the interpretation of the data they produce. Most efferent assays use a "probe stimulus" to produce an OAE and an "elicitor stimulus" to evoke efferent activity and thereby change the OAE. However, little attention has been given to whether the probe stimulus itself elicits efferent activity. In addition, most studies use only contralateral ( re the probe) elicitors and do not include measurements to rule out middle-ear muscle (MEM) contractions. Here we describe methods to deal with these problems and present a new efferent assay based on stimulus frequency OAEs (SFOAEs) that incorporates these methods. By using a postelicitor window, we make measurements in individual subjects of efferent effects from contralateral, ipsilateral, and bilateral elicitors. Using our SFOAE assay, we demonstrate that commonly used probe sounds (clicks, tone pips, and tone pairs) elicit efferent activity, by themselves. Thus, results of efferent assays using these probe stimuli can be confounded by unwanted efferent activation. In contrast, the single 40 dB SPL tone used as the probe sound for SFOAE-based measurements evoked little or no efferent activity. Since they evoke efferent activation, clicks, tone pips, and tone pairs can be used in an adaptation efferent assay, but such paradigms are limited in measurement scope compared to paradigms that separate probe and elicitor stimuli. Finally, we describe tests to distinguish middle-ear muscle (MEM) effects from MOC effects for a number of OAE assays and show results from SFOAE-based tests. The SFOAE assay used in this study provides a sensitive, flexible, frequency-specific assay of medial efferent activation that uses a low-level probe sound that elicits little or no efferent activity, and thus provides results that can be interpreted without the confound of unintended efferent activation.


Figures

Figure 1
Figure 1
A vector diagram showing that the total ear-canal sound pressure is made of a sound source component and a stimulus frequency otoacoustic emission (SFOAE) component (greatly exaggerated here). The solid lines show the “baseline” (i.e., before efferent stimulation) pressures (labeled 1). Deviations from the “baseline” condition are produced by efferent activity changing the SFOAE, as shown by the long-dash lines (labeled 2). As long as the source pressure remains constant, the change in the total pressure (ΔP) is the same as the efferent-induced change in the SFOAE (ΔSFOAE—the short-dashed line).
Figure 2
Figure 2
Examples of a measurement of total ear-canal sound pressure at the probe-tone frequency (A) and computed efferent-induced changes in the SFOAE (ΔSFOAE) for three elicitor lateralities (BD). For a contralateral elicitor, A to B illustrates the transformation from total sound pressure (A) to the ΔSFOAE (B). The left panels are amplitudes and the right panels are the corresponding phases. Row A was obtained by digitally heterodyning measurements originally sampled at 20 kHz. Row B was obtained from the data of row A by calculating the vector average of the data in the baseline window of A and vector subtracting this, at each time point, from the data in A. The ΔSFOAEs in C and D were obtained in a similar way from ear-canal sound pressures that are not illustrated. As shown at the bottom, a continuous probe tone (40 dB SPL, 1.1 kHz) was presented in the measurement (right) ear and a 2.5 s broadband noise elicitor (60 dB SPL) was presented in the contralateral ear (rows A and B), the ipsilateral ear (row C), and both ears (row D). The analysis window shows the time during which efferent-induced ΔSFOAE responses were averaged; it begins 50 ms after the termination of the elicitor and lasts for 100 ms. Subject 84, right ear.
Figure 3
Figure 3
A single measurement set showing changes in stimulus frequency otoacoustic emissions (ΔSFOAEs) measured simultaneously in both ears. The elicitors were 60 dB SPL broadband noise bursts; the probes were 40 dB SPL, 1.1 kHz tones. The bars labeled “Background Fluctuation” are averages from runs with no elicitor. Note: Amplitudes are in dB so, in linear terms, in the left ear the difference between the ipsilateral and bilateral responses is about 10 times the amplitude of the background fluctuation. Subject 84.
Figure 4
Figure 4
Efferent activity elicited by common probe sounds. Shown are time courses of the changes in stimulus frequency otoacoustic emissions (ΔSFOAEs) elicited by various sounds normally used as probe sounds. A. The tone pips were 900 Hz, with 1 period rise and fall times and two periods of plateau, and were presented 1 pip every 20 ms. B. The clicks were produced by 0.1 ms square electrical pulses, presented every 20 ms. C. The two-tone stimulus had a lower-frequency primary (f1) at 900 Hz, and a higher-frequency primary (f2 = 1.3 * f1) which was 10 dB lower in level than the f1 level listed in panel C. D. The single-tone stimulus was 900 Hz. The sound levels of the stimuli are given in peak equivalent SPL (pSPL) for tone pips and clicks, and normal (RMS) SPL for single tones and for the f1 tone of the two-tone stimuli. All elicitors were in the left ear. The probe tone was 40 dB SPL, 900 Hz in the right ear of subject 82. Each trace is the magnitude of the synchronously averaged heterodyne waveforms from four sets of data, each with six 5 s response periods. The abbreviations in parentheses indicate the type of otoacoustic emission (OAE) elicited by each probe sound: transient-evoked OAEs (TEOAEs), click-evoked OAEs (CEOAEs), distortion-product OAEs (DPOAEs), and stimulus frequency OAEs (SFOAEs).
Figure 5
Figure 5
Efferent activity evoked by sounds often used as OAE-generating probe sounds. Each panel shows ΔSFOAE-normalized magnitudes in the ipsilateral ear for the last second of elicitor stimulation versus elicitor sound level in the contralateral ear, for the elicitor type listed at the top of the panel. The type of OAE produced by the elicitor is shown in parentheses. The ΔSFOAE was normalized by dividing the ΔSFOAE magnitude by the total SFOAE magnitude (which was obtained by suppression, see Methods). In B, the two lines that go off-scale are most likely due to elicited middle-ear-muscle contractions (see text). The three off-scale points are, from line 1: 90 at 63 dB SPL, 154 at 73 dB SPL; from line 2: 101 at 73 dB SPL. Group B1 data from the right ear of subject 82 (4 level functions), and the left ears of subjects 85, 87, 88 (2 level functions each). Probe frequencies between 0.9 and 1.1 kHz.
Figure 6
Figure 6
Efferent activity elicited by common probe sounds and wideband noise bursts for ipsilateral (○), contralateral (△), and bilateral (□) elicitors. The X’s show the average background fluctuation measurement for each elicitor and level (derived from the “no-elicitor” runs). Top. Normalized ΔSFOAE magnitudes from the postelicitor window, averaged across subjects, as a function of elicitor sound level. Error bars extend ±1 SEM from each average. For clarity, the errror bars were slightly displaced to the right for bilateral elicitors and to the left for ipsilateral elicitors (see upper-right panel ). Bottom. Triangles show measured versus estimated contralateral efferent effects. Estimated contralateral |ΔSFOAE| = bilateral |ΔSFOAE| − ipsilateral |ΔSFOAE|. X’s show the corresponding background fluctuation points plotted at zero estimated contralateral effect. Subject Group B2, 9 ears from 6 subjects (subject No. and ears are: 61R, 68LR, 85L, 87LR,93R, 109LR). Probe frequencies between 0.9 and 1.1 kHz. The off-scale point for clicks had an amplitude of 63%. The results at 70 dB, particularly for clicks, may have been affected by evoked middle-ear muscle contractions included in these results. As judged by t-tests of the distributions across subjects at each elicitor level and laterality, points were significantly above the corresponding no-elicitor runs at the 0.05 level (*), the 0.01 level (**), or the 0.001 level (***) as follows (ipsi = ipsilateral, contra = contralateral, bi = bilateral): For PIPs: at 50 dB, bi*; at 60 dB, ipsi* contra* bi***; at 70 dB, ipsi**, contra***, bi**. For Clicks: at 50 dB, contra**, bi*; at 60 dB, ipsi*, contra**, bi***; at 70 dB, ipsi**, contra**, bi***. For Tones: at 50 dB, ipsi*, bi**; at 60 and 70 dB, ipsi***, bi***. For Noise: at 50 dB, ipsi**, contra***, bi***, at 60 dB,all***.
Figure 7
Figure 7
Example group delay tests for medial efferent (MOC) versus middle-ear muscle (MEM) activity. Shown are ΔSFOAE phase versus probe-frequency plots for contralateral, ipsilateral, and bilateral broadband (nonflattened) noise elicitors in one subject (No. 31, subject Group C). The points were every 20 Hz (at the frequency tick marks). Rows B–E had a probe-tone level of 30 dB SPL; row A had a probe-tone level of 50 dB SPL. The long group delays (i.e., high slopes in the phase vs. frequency plots) for 45–65 dB SPL elicitors indicate that MOC effects dominated at these levels (the straight line in the row D phase plot shows the slope for a 10 ms delay). The short group delays for the 75 dB elicitor and 50 dB probe tone (row A) indicate that MEM effects dominated the response. The group delays for the 75 dB elicitor and 30 dB probe tone (row B) show evidence of both long and short group delays and are designated “Mixed” (see text).
Figure 8
Figure 8
Medial efferent vs. middle-ear muscle test results for 7 subjects (Group C). Symbols indicate the elicitor levels at which the response was dominated by middle-ear muscle activity (MEM), medial efferent activity (MOC), or showed evidence for both (Mixed - see text for details). Probe frequencies between 1 and 2 kHz. Elicitors: unflattened broadband noise. The numbers of runs done at each level for each subject (in order of highest to lowest level) were: S21: 2,3,2; S24: 3,1,1; S27: 2,1,1,3,2; S31: 2,3,5,3,6,2; S35: 2,1,1,3; S36: 1,1,1,1; S37: 1,1,1,1.

Similar articles

Cited by

References

    1. Backus B, Guinan Jr JJ, Lilaonitkul W. The time course of the medial olivocochlear efferent reflex in humans. Assoc. Res. Otolaryngol. Abs. 2003;26:107. - PMC - PubMed
    1. Berlin CI, Hood LJ, Wen H, Szabo P, Cecola RP, Rigby P, Jackson DF. Contralateral suppression of non-linear click-evoked otoacoustic emissions. Hear. Res. 1993;71:1–11. doi: 10.1016/0378-5955(93)90015-S. - DOI - PubMed
    1. Berlin CI, Hood LJ, Hurley A, Wen H, Kemp DT. Binaural noise suppresses linear click-evoked otoacoustic emissions more than ipsilateral or contralateral noise. Hear. Res. 1995;87:6–103. doi: 10.1016/0378-5955(95)00082-F. - DOI - PubMed
    1. Buki B, Wit HP, Avan P. Olivocochlear efferent vs. middle-ear contributions to the alteration of otoacoustic emissions by contralateral noise. Brain Res. 2000;852:140–150. doi: 10.1016/S0006-8993(99)02227-1. - DOI - PubMed
    1. Cannon MW. Electrical impedance, current pathways and voltage sources in the guinea pig cochlea. Syracuse NY: Institute for Sensory Research, Syracuse University; 1976.

Publication types

LinkOut - more resources