. 2003 Jun 24;100(13):7767-72.
doi: 10.1073/pnas.1336920100. Epub 2003 Jun 11.

Stepwise cytoskeletal polarization as a series of checkpoints in innate but not adaptive cytolytic killing

Affiliations

Stepwise cytoskeletal polarization as a series of checkpoints in innate but not adaptive cytolytic killing

Christoph Wulfing et al. Proc Natl Acad Sci U S A. .

Abstract

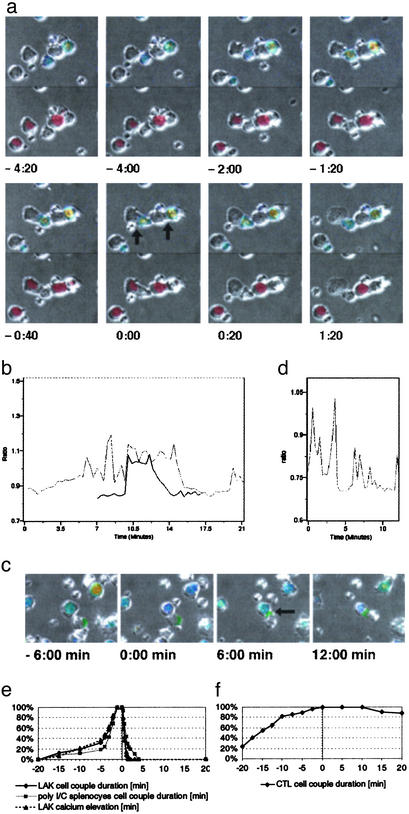
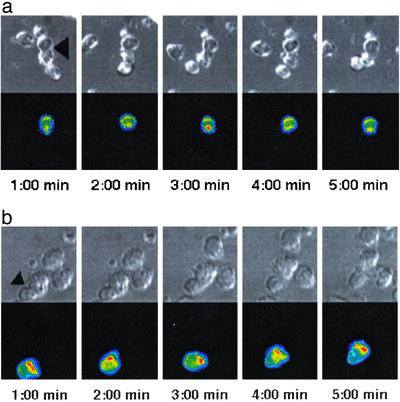
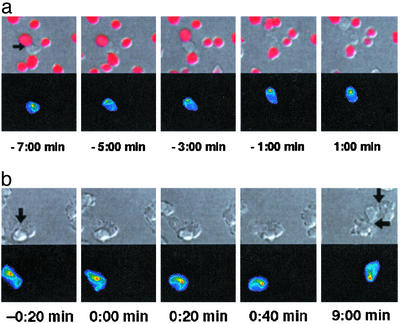
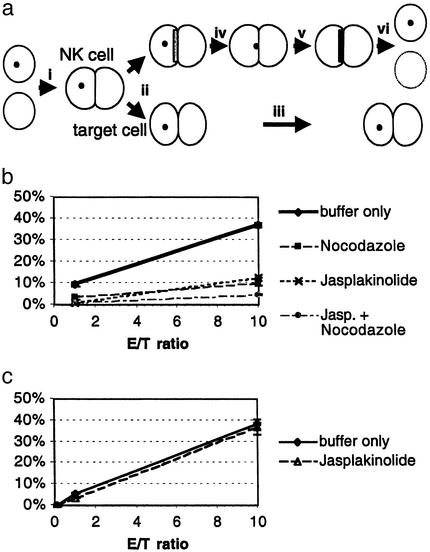
Cytolytic killing is a major effector mechanism in the elimination of virally infected and tumor cells. The innate cytolytic effectors, natural killer (NK) cells, and the adaptive effectors, cytotoxic T cells (CTL), despite differential immune recognition, both use the same lytic mechanism, cytolytic granule release. Using live cell video fluorescence microscopy in various primary cell models of NK cell and CTL killing, we show here that on tight target cell contact, a majority of the NK cells established cytoskeletal polarity required for effective lytic function slowly or incompletely. In contrast, CTLs established cytoskeletal polarity rapidly. In addition, NK cell killing was uniquely sensitive to minor interference with cytoskeletal dynamics. We propose that the stepwise NK cell cytoskeletal polarization constitutes a series of checkpoints in NK cell killing. In addition, the use of more deliberate progression to effector function to compensate for inferior immune recognition specificity provides a mechanistic explanation for how the same effector function can be used in the different functional contexts of the innate and adaptive immune response.


Figures

Fig. 1.
Fig. 1.
Three target cell fates in NK cell killing, rapid killing, delayed killing, and nonkilling. (a) The interaction of two LAKs with YAC-1 target cells (black arrows at t = 0:00 min) is shown in panels from Movie 1. DIC bright-field images have been duplicated. The top is overlaid with a rainbow color scale representation of the NK cell intracellular calcium concentration (blue for low to red for high), which also identifies NK cells. The bottom is overlaid with an image of the red fluorescent dye SNARF that is released on target cell lysis and also identifies target cells. The left couple displays a rapid killing event. The tight interface forms at -1:20 min, lysis (SNARF release and target cell swelling) occurs between 0:00 and 0:20 min, and detachment occurs at 1:20 min. The right cell couple displays a delayed killing event. Persistent tight cell apposition is visible, but target cell lysis can be seen only in Movie 1. An additional small NK cell and the NK cell of the left couple touch the target cell of the right couple but do not form a tight interface and are, therefore, highly unlikely to contribute to the lysis of that cell. (b) Traces of the NK cell intracellular calcium concentration (as the ratio of the emission intensities of the calcium-sensitive dye fura 2) for the two cell couples shown in a are given. The dark and light traces correspond to the NK cells in the left and right couples, respectively. Because of NK cell movement, one trace is shown for only part of the experiment. Target cell lysis coincides with the decline in the calcium concentration at 13 and 15 min, respectively. At 20 min, an elevation of the intracellular calcium concentration of the right NK cell as triggered by new target cell contact can be seen. (c) A nonkilling interaction of a LAK with a polarized YAC-1 target cell (arrow at t = 6:00 min) is shown in panels from Movie 2. The NK cell has been overlaid with a representation of the intracellular calcium concentration similar to a. The target cell has been overlaid with the intensity of the intercellular adhesion molecule (ICAM)-1–GFP fluorescence in green as a marker of polarity. High ICAM-1 concentration marks the posterior end of the target cell. Interface formation was at t = 0:00 min. As seen here and better in Movie 2, only a narrow interface was maintained. (d) The trace of the intracellular calcium concentration similar to b is shown for the NK cell from c.(e) The cumulative percentage of the indicated type of NK cells in killing interactions bound to their YAC-1 target cells or showing an elevation of their intracellular calcium concentration before (negative time values) and after (positive time values) lysis (t = 0 min) is shown. Thirty to 40 cell couples from at least six independent experiments were analyzed per condition. (f) The cumulative percentage of P14 CTLs in killing interactions bound to their target cells before (negative time values) and after (positive time values) the onset of blebbing (t = 0 min) is shown. Data for EL4 and H2-Db-transfected CH27 target cells were pooled. Thirty-four cell couples from five independent experiments were analyzed.
Fig. 2.
Fig. 2.
Actin accumulates differentially at the NK cell- and CTL-target cell interface. (a) A nonkilling interaction of an actin-GFP transduced LAK with a YAC-1 target cell is shown in panels from Movie 5. (Upper) A DIC image. (Lower) A projection of the 3D actin–GFP fluorescence data in a rainbow color scale (increasing from blue to red). The interface is marked with an arrow (Left). The NK cell is on top, and the target cell is on the bottom. A strong actin accumulation with an extended NK cell lamellopod can be seen in the third panel (3:00 min). One additional cell each is bound to the NK and the target cell. These interactions were not productive, because the cellular interfaces never reached two-thirds of the NK cell diameter. (b) A persistent interaction of an actin–GFP-transduced P14 CTL with an EL4 target cell is shown in panels from Movie 8, similar to a. The interface is marked with an arrow (Left); the CTL is on the bottom, the target cell on top.
Fig. 3.
Fig. 3.
The MTOC orients toward the center of the interface differentially in NK cell– and CTL–target cell interactions. (a) A delayed killing interaction of a tubulin—GFP-transduced LAK with a YAC-1 target cell is shown in panels from Movie 6. (Upper) A DIC image is overlaid with a red intensity scale of the SNARF fluorescence to visualize membrane permeability. (Lower) A projection of the 3D tubulin–GFP fluorescence data is shown in a rainbow color scale (increasing from blue to red). The interface is marked with an arrow (Left). Target cell lysis is set to t = 0:00 min. NK cell–target cell contact without MTOC localization at the interface can be seen (Left). The MTOC reorients 5 min before target cell lysis (t = –5:00 min), remains at the interface until target cell lysis, and moves away from the interface after lysis (Right). (b) An interaction of a tubulin–GFP-transduced P14 CTL with an EL4 target cell is shown in sections derived from panels from Movie 9 similar to a but lacking the SNARF overlay. The cell couple is marked with an arrow (Left), the CTL is on the left, and the target cell is on the right. In the first four panels, a rapid reorientation of the CTL MTOC toward the center of the interface after interface formation (t = 0:00 min) can be seen. In the last frame, blebbing indicates substantial target cell damage; the MTOC, however, is still located at the center of the interface (bottom arrow). The CTL has formed a second interface (top arrow). A later reorientation of the MTOC toward the second interface can be seen in Movie 9.
Fig. 4.
Fig. 4.
Stepwise cytoskeletal polarization in effective NK cell killing. (a) A schematic representation of the stepwise polarization in NK cell killing is given. (i) NK cell killing begins with the formation of a tight NK cell–target cell couple. (ii) If the initial tight interface cannot be maintained (intermittent actin accumulation at the interface as depicted with a light gray bar is likely important for interface maintenance), (iii) the cell couple persists without target cell lysis. If a tight interface is maintained, (iv) the MTOC as depicted with a black dot can reorient toward the interface. (v) Actin accumulation at the interface as depicted with a dark gray bar always coincides with the lytic hit that (vi) leads to target cell lysis. (b) LAK-mediated YAC-1 killing was determined in a 1-h chromium-release assay (matching the duration of the corresponding microscopy experiments) as percent of specific lysis. For moderate interference with actin and microtubule dynamics, LAKs were treated with Jasplakinolide, Nocodazole, or both (Experimental Procedures). One representative of three assays is shown. (c) P14 CTL-mediated EL4 target cell killing was independent of a low concentration (Experimental Procedures)of Jasplakinolide, as in b.

Similar articles

Cited by

References

    1. Trinchieri, G. (1989) Adv. Immunol. 47, 187-376. - PMC - PubMed
    1. Janeway, C. A., Jr., & Medzhitov, R. (2002) Annu. Rev. Immunol. 20, 197-216. - PubMed
    1. Yokoyama, W. M. (1995) Curr. Opin. Immunol. 7, 110-120. - PubMed
    1. Lanier, L. L. (1998) Annu. Rev. Immunol. 16, 359-393. - PubMed
    1. Moretta, A., Biassoni, R., Bottino, C., Mingari, M. C. & Moretta, L. (2000) Immunol. Today 21, 228-234. - PubMed

Publication types

LinkOut - more resources