

Genome scan meta-analysis of schizophrenia and bipolar disorder, part III: Bipolar disorder
- PMID: 12802785
- PMCID: PMC1180589
- DOI: 10.1086/376547
Genome scan meta-analysis of schizophrenia and bipolar disorder, part III: Bipolar disorder
Abstract
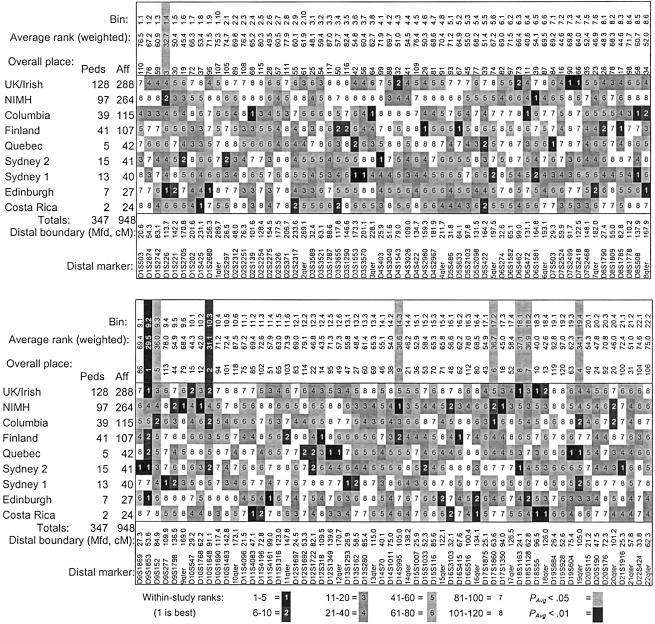
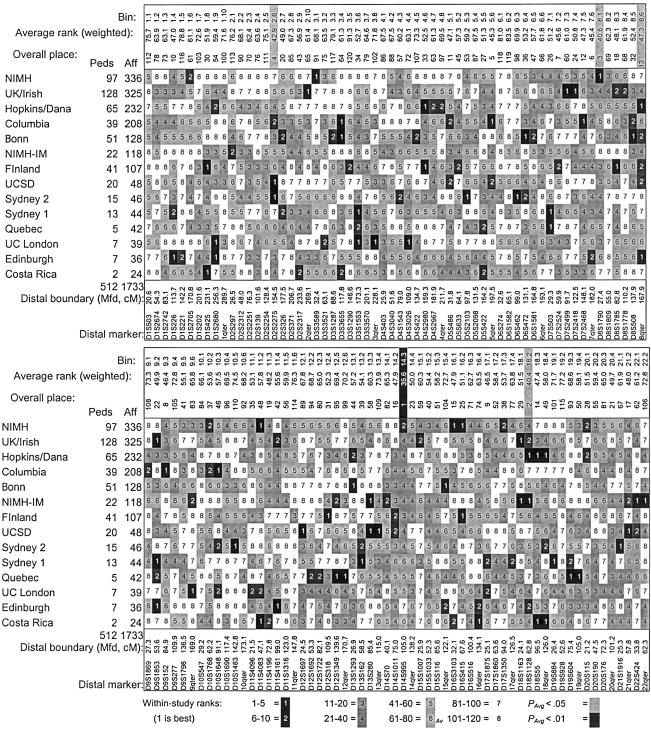
Genome scans of bipolar disorder (BPD) have not produced consistent evidence for linkage. The rank-based genome scan meta-analysis (GSMA) method was applied to 18 BPD genome scan data sets in an effort to identify regions with significant support for linkage in the combined data. The two primary analyses considered available linkage data for "very narrow" (i.e., BP-I and schizoaffective disorder-BP) and "narrow" (i.e., adding BP-II disorder) disease models, with the ranks weighted for sample size. A "broad" model (i.e., adding recurrent major depression) and unweighted analyses were also performed. No region achieved genomewide statistical significance by several simulation-based criteria. The most significant P values (<.01) were observed on chromosomes 9p22.3-21.1 (very narrow), 10q11.21-22.1 (very narrow), and 14q24.1-32.12 (narrow). Nominally significant P values were observed in adjacent bins on chromosomes 9p and 18p-q, across all three disease models on chromosomes 14q and 18p-q, and across two models on chromosome 8q. Relatively few BPD pedigrees have been studied under narrow disease models relative to the schizophrenia GSMA data set, which produced more significant results. There was no overlap of the highest-ranked regions for the two disorders. The present results for the very narrow model are promising but suggest that more and larger data sets are needed. Alternatively, linkage might be detected in certain populations or subsets of pedigrees. The narrow and broad data sets had considerable power, according to simulation studies, but did not produce more highly significant evidence for linkage. We note that meta-analysis can sometimes provide support for linkage but cannot disprove linkage in any candidate region.
Figures
References
Electronic-Database Information
-
- Center for Medical Genetics, http://research.marshfieldclinic.org/genetics (for the Marshfield genetic map)
-
- CEPH-Généthon Integrated Map, http://www.cephb.fr/ceph-genethon-map.html
-
- D. F. Levinson Research, http://depressiongenetics.med.upenn.edu/meta-analysis.html (for further details, including weighted and unweighted ranks for each bin for each study)
-
- Genetic Location Database, http://cedar.genetics.soton.ac.uk/public_html/ldb.html (for the Cedar genetic map)
-
- NCBI Home Page, http://www.ncbi.nlm.nih.gov/ (for cytogenetic locations obtained from the April, 2002 freeze of the Human Genome Project)
References
-
- Badenhop RF, Moses MJ, Scimone A, Mitchell PB, Ewen-White KR, Rosso A, Donald JA, Adams LJ, Schofield PR (2002) A genome screen of 13 bipolar affective disorder pedigrees provides evidence for susceptibility loci on chromosome 3 as well as chromosomes 9, 13 and 19. Mol Psychiatry 7:851–859 - PubMed
-
- Badner JA, Gershon ES (2002) Meta-analysis of whole-genome linkage scans of bipolar disorder and schizophrenia. Mol Psychiatry 7:405–411 - PubMed
-
- Baron M (2002) Manic depression genes and the new millennium: poised for discovery. Mol Psychiatry 7:342–358 - PubMed
-
- Baron M, Risch N, Hamburger R, Mandel B, Kushner S, Newman M, Drumer D, Belmaker RH (1987) Genetic linkage between X-chromosome markers and bipolar affective illness. Nature 326:289–292 - PubMed
Publication types
MeSH terms
Grants and funding
- K24 MH064197/MH/NIMH NIH HHS/United States
- K24 MH 064197/MH/NIMH NIH HHS/United States
- R01 MH063876/MH/NIMH NIH HHS/United States
- MH 42535/MH/NIMH NIH HHS/United States
- MH 01099/MH/NIMH NIH HHS/United States
- U01 MH 46274/MH/NIMH NIH HHS/United States
- R01 MH062276/MH/NIMH NIH HHS/United States
- MH 59567/MH/NIMH NIH HHS/United States
- U01 MH 54794/MH/NIMH NIH HHS/United States
- MH 43979/MH/NIMH NIH HHS/United States
- U01 MH 54701/MH/NIMH NIH HHS/United States
- R01 NS 37484/NS/NINDS NIH HHS/United States
- R01 MH059553/MH/NIMH NIH HHS/United States
- R01 MH 62276/MH/NIMH NIH HHS/United States
- R01 MH 49499/MH/NIMH NIH HHS/United States
- MH 59553/MH/NIMH NIH HHS/United States
- M01 RR 00827/RR/NCRR NIH HHS/United States
- G9309834/MRC_/Medical Research Council/United Kingdom
- MH 63876/MH/NIMH NIH HHS/United States
- R01 MH 42643/MH/NIMH NIH HHS/United States
- R01 MH059567/MH/NIMH NIH HHS/United States
- R01 MH042243/MH/NIMH NIH HHS/United States
- U01 MH 46280/MH/NIMH NIH HHS/United States
- R01 MH059545/MH/NIMH NIH HHS/United States
- R01 MH 59545/MH/NIMH NIH HHS/United States
- R01 MH 042463/MH/NIMH NIH HHS/United States
- MH 42243/MH/NIMH NIH HHS/United States
- MH 00176/MH/NIMH NIH HHS/United States
- 1R01 MH 3448/MH/NIMH NIH HHS/United States
- R01 MH049499/MH/NIMH NIH HHS/United States
- WT_/Wellcome Trust/United Kingdom
- M01 RR000827/RR/NCRR NIH HHS/United States
- MH 47612/MH/NIMH NIH HHS/United States
- R01 NS037484/NS/NINDS NIH HHS/United States
- K02 MH 01089/MH/NIMH NIH HHS/United States
- U01 MH 54723/MH/NIMH NIH HHS/United States
- U01 MH 46282/MH/NIMH NIH HHS/United States
- G9810900/MRC_/Medical Research Council/United Kingdom
- N01 HG 65493/HG/NHGRI NIH HHS/United States
LinkOut - more resources
Full Text Sources
Other Literature Sources
Medical
Molecular Biology Databases
