

Genome scan meta-analysis of schizophrenia and bipolar disorder, part II: Schizophrenia
- PMID: 12802786
- PMCID: PMC1180588
- DOI: 10.1086/376549
Genome scan meta-analysis of schizophrenia and bipolar disorder, part II: Schizophrenia
Abstract
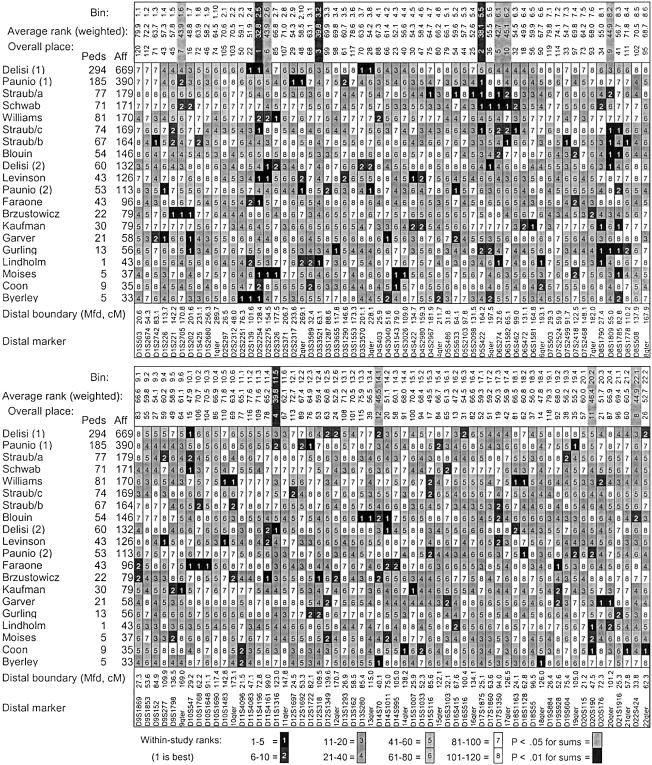
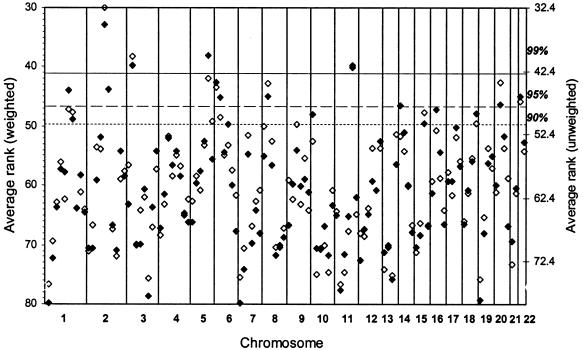
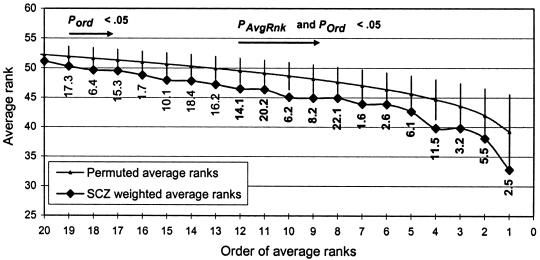
Schizophrenia is a common disorder with high heritability and a 10-fold increase in risk to siblings of probands. Replication has been inconsistent for reports of significant genetic linkage. To assess evidence for linkage across studies, rank-based genome scan meta-analysis (GSMA) was applied to data from 20 schizophrenia genome scans. Each marker for each scan was assigned to 1 of 120 30-cM bins, with the bins ranked by linkage scores (1 = most significant) and the ranks averaged across studies (R(avg)) and then weighted for sample size (N(sqrt)[affected casess]). A permutation test was used to compute the probability of observing, by chance, each bin's average rank (P(AvgRnk)) or of observing it for a bin with the same place (first, second, etc.) in the order of average ranks in each permutation (P(ord)). The GSMA produced significant genomewide evidence for linkage on chromosome 2q (PAvgRnk<.000417). Two aggregate criteria for linkage were also met (clusters of nominally significant P values that did not occur in 1,000 replicates of the entire data set with no linkage present): 12 consecutive bins with both P(AvgRnk) and P(ord)<.05, including regions of chromosomes 5q, 3p, 11q, 6p, 1q, 22q, 8p, 20q, and 14p, and 19 consecutive bins with P(ord)<.05, additionally including regions of chromosomes 16q, 18q, 10p, 15q, 6q, and 17q. There is greater consistency of linkage results across studies than has been previously recognized. The results suggest that some or all of these regions contain loci that increase susceptibility to schizophrenia in diverse populations.
Figures
References
Electronic-Database Information
-
- Center for Medical Genetics, http://research.marshfieldclinic.org/genetics/ (for the Marshfield map)
-
- CEPH-Généthon Integrated Map, http://www.cephb.fr/ceph-genethon-map.html
-
- D. F. Levinson Research, http://depressiongenetics.med.upenn.edu/meta-analysis.html (for further details, including weighted and unweighted ranks for each bin for each study)
-
- Genetic Location Database, http://cedar.genetics.soton.ac.uk/public_html/ldb.html (for the Cedar genetic map)
-
- National Center for Biotechnology Information Home Page, http://www.ncbi.nlm.nih.gov/ (for cytogenetic locations obtained from the April 2002 freeze of the Human Genome Project)
References
-
- Badner JA, Gershon ES (2002a) Meta-analysis of whole-genome linkage scans of bipolar disorder and schizophrenia. Mol Psychiatry 7:405–411 - PubMed
-
- ——— (2002b) Regional meta-analysis of published data supports linkage of autism with markers on chromosome 7. Mol Psychiatry 7:56–66 - PubMed
-
- Bailer U, Leisch F, Meszaros K, Lenzinger E, Willinger U, Strobl R, Heiden A, Gebhardt C, Doge E, Fuchs K, Sieghart W, Kasper S, Hornik K, Aschauer HN (2002) Genome scan for susceptibility loci for schizophrenia and bipolar disorder. Biol Psychiatry 52:40–52 - PubMed
-
- Barr CL, Kennedy JL, Pakstis AJ, Wetterberg L, Sjogren B, Bierut L, Wadelius C, Wahlstrom J, Martinsson T, Giuffra L (1994) Progress in a genome scan for linkage in schizophrenia in a large Swedish kindred. Am J Med Genet 54:51–58 - PubMed
-
- Blouin JL, Dombroski BA, Nath SK, Lasseter VK, Wolyniec PS, Nestadt G, Thornquist M, et al (1998) Schizophrenia susceptibility loci on chromosomes 13q32 and 8p21. Nat Genet 20:70–73 - PubMed
Publication types
MeSH terms
Grants and funding
- K24 MH064197/MH/NIMH NIH HHS/United States
- R01 MH044292/MH/NIMH NIH HHS/United States
- 1R01 MH 41874-01/MH/NIMH NIH HHS/United States
- K24 MH 64197/MH/NIMH NIH HHS/United States
- R01 MH062440/MH/NIMH NIH HHS/United States
- R01 MH 61602/MH/NIMH NIH HHS/United States
- U01 MH 46289/MH/NIMH NIH HHS/United States
- R01 MH 44245/MH/NIMH NIH HHS/United States
- U01 MH046318/MH/NIMH NIH HHS/United States
- K02 MH 01089/MH/NIMH NIH HHS/United States
- 5U01 MH 46318/MH/NIMH NIH HHS/United States
- G9309834/MRC_/Medical Research Council/United Kingdom
- R01 MH 42643/MH/NIMH NIH HHS/United States
- U01 MH046276/MH/NIMH NIH HHS/United States
- R01 MH 45390/MH/NIMH NIH HHS/United States
- R01 MH041953/MH/NIMH NIH HHS/United States
- R01 MH 41953/MH/NIMH NIH HHS/United States
- R01 MH 45097/MH/NIMH NIH HHS/United States
- U01 MH046289/MH/NIMH NIH HHS/United States
- R01 MH 56098/MH/NIMH NIH HHS/United States
- 1R37 MH 43518/MH/NIMH NIH HHS/United States
- WT_/Wellcome Trust/United Kingdom
- R01 MH 52537/MH/NIMH NIH HHS/United States
- R01 MH 62440/MH/NIMH NIH HHS/United States
- U01 MH 44292/MH/NIMH NIH HHS/United States
- K08 MH 01392/MH/NIMH NIH HHS/United States
- G9810900/MRC_/Medical Research Council/United Kingdom
- R37 MH043518/MH/NIMH NIH HHS/United States
- U01 MH 46276/MH/NIMH NIH HHS/United States
- R01 MH 4558/MH/NIMH NIH HHS/United States
LinkOut - more resources
Full Text Sources
Other Literature Sources
Medical
Miscellaneous
