. 2003 Jun 16;22(12):2934-47.
doi: 10.1093/emboj/cdg307.

Survivin is required for a sustained spindle checkpoint arrest in response to lack of tension

Affiliations

Survivin is required for a sustained spindle checkpoint arrest in response to lack of tension

Susanne M A Lens et al. EMBO J. .

Abstract

Genetic evidence is mounting that survivin plays a crucial role in mitosis, but its exact role in human cell division remains elusive. We show that mammalian cells lacking survivin are unable to align their chromosomes, fail to recruit Aurora B to kinetochores and become polyploid at a very high frequency. Survivin-depleted cells enter mitosis with normal kinetics, but are delayed in prometaphase in a BubR1/Mad2-dependent fashion. Nonetheless, these cells exit mitosis prior to completion of chromosome congression and without sister chromatid segregation, indicating that the spindle assembly checkpoint is not fully functional. Indeed, in survivin-depleted cells, BubR1 and Mad2 are prematurely displaced from kinetochores, yet no tension is generated at kinetochores. Importantly, these cells fail to respond to drugs that prevent tension, but do arrest in mitosis after depolymerization of the mitotic spindle. This demonstrates that survivin is not required for initial checkpoint activation, or for sustained checkpoint activation by loss of microtubules. However, stable association of BubR1 to kinetochores and sustained checkpoint signalling in response to lack of tension crucially depend on survivin.


Figures
None
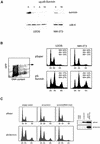
Fig. 1. pS-Survivin efficiently down-regulates endogenous survivin expression resulting in polyploidy. U2OS and NIH-3T3 cells were co-transfected with the indicated amounts of pS-Survivin or pSuper and 1 µg of a CD20 (A) or spectrin–GFP (B) expression vector. (A) At 48 h after transfection, transfected cells were collected by MACS and analysed by western blotting. Blots were probed with anti-survivin pAb and subsequently reprobed with anti-cdk-4 to check for equal loading. (B) At 48 h after transfection, DNA profiles of the GFP-positive cells were determined by FACS analysis. (C) Cells were transfected with 10 µg of pS-Survivin or empty pSuper vector in combination with 0.2 µg of an expression plasmid for FLAG-tagged wild-type survivin (wt-survivin) or a survivin mutant carrying two silent mutations in the RNAi target sequence (survivin-RNAi/mut). At 48 h after transfection, some of the cells were analysed by western blotting (anti-FLAG), while the remaining cells were fixed and DNA profiles of the transfected cells were determined by FACS analysis.
None
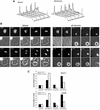
Fig. 2. Survivin knock-down interferes with normal mitotic progression. U2OS cells were transfected with 10 µg of pS-Survivin or empty pSuper vector as indicated. Immediately following transfection, cells were synchronized with thymidine for 24 h and subsequently released from this block. (A) Cells were fixed at the indicated time points after release and DNA profiles of the transfected cell populations were determined by FACS analysis. (B) Cells were grown on glass-bottom culture dishes and cotransfected with H2B–GFP and the indicated plasmids. Cells were followed by time-lapse imaging 12 h after release from the thymidine block. H2B–GFP fluorescence is shown on top, while the corresponding phase-contrast image is below. Time indicated in the upper left corner refers to the elapsed time (h:min) from the start of the time-lapse. (C) Mitotic stages were scored in DLD-1 and U2OS cells co-transfected with H2B–GFP and pSuper or pS-Survivin.
None
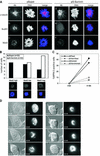
Fig. 3. Effects of survivin depletion on spindle formation and the localization of Aurora B, BubR1 and Mad2. U2OS cells cotransfected with H2B–GFP (1 µg) and 10 µg pSuper (left panels) or pS-Survivin (right panels) were fixed and stained with antibodies against the indicated proteins. Transfected, mitotic cells were imaged by confocal microscopy, by analysis of H2B–GFP staining of DNA (column labelled H2B–GFP). For better colour contrast, H2B–GFP is depicted in blue. (A) Confocal images of transfected, mitotic U2OS cells stained with antibodies against survivin (top row), Aurora B (second row), CREST (third row) or α-tubulin (bottom row). (B) BubR1 localization in mitotic U2OS cells. In control cells (left panels) BubR1 is localized at kinetochores during prophase (a) and prometaphase (b), but is absent from kinetochores during anaphase (c). In survivin knock-down cells (right panels), BubR1 is present on kinetochores during prophase (d), but is no longer localized at kinetochores during prometaphase (e and f). (C) Mad2 localization in mitotic U2OS cells. In pSuper-transfected cells (left panels) Mad2 is localized to unattached kinetochores during prophase (a) and prometaphase (b and c) and absent from kinetochores of cells that have entered anaphase (d). In pS-Survivin-transfected cells (right panels) Mad2 is present on kinetochores during prophase (e), but is no longer localized at kinetochores during prometaphase (f–h). (D) Knock-down of BubR1 and Mad2 overcomes the prometaphase delay in survivin knock-down cells. U2OS cells cotransfected with 1 µg H2B–GFP, 7.5 µg pS-Survivin plus 7.5 μg pS-BubR1 (upper panels) or with 7.5 µg pS-Survivin plus 7.5 μg pS-Mad2 (lower panels), were synchronized and life imaging was started 12 h after release from a thymidine block. Numbers indicated in the upper right corner indicate the elapsed time (h:min) from the start of the time-lapse. H2B–GFP fluorescence is shown on top, while the corresponding DIC image is below. Protein levels (western blot) of pS-BubR1- and pS-Mad2-transfected cells are shown on the left hand side of the corresponding time-lapse. Asterisk indicates non-specific band.
None
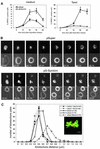
Fig. 4. Survivin is required for a taxol-induced spindle checkpoint arrest. (A) U2OS cells cotransfected with 1 µg spectrin–GFP and 10 µg pSuper (closed squares) or pS-Survivin (open squares) were synchronized with thymidine and harvested at the indicated time points after release from the block (left panel). Taxol was added immediately after thymidine release (right panel). PI staining was combined with intracellular staining for MPM-2 to quantify mitotic cells. Note the difference in scale between the two panels, since mitotic exit is not blocked in the absence of taxol (left panel). Average ± SD of three independent experiments is shown. (B) U2OS cells cotransfected with 1 µg H2B–GFP and 10 µg pSuper (upper panels) or pS-Survivin (lower panels) were synchronized and life imaging was started 12 h after release in the presence of taxol. H2B–GFP fluorescence is shown on top, while the corresponding phase-contrast image is below. Numbers indicated in the lower left corner indicate the elapsed time (h:min) from the start of mitosis. In the pS-Survivin panel, numbers (h:min) in the upper right corner indicate the elapsed time of a second cell that had entered mitosis 64 min earlier. Total duration of mitosis of this particular cell was 3:20. (C) Histograms of sister kinetochore distances in pSuper- (open symbols) and pS-Survivin-transfected (closed symbols) cells, treated with (dashed line) or without (solid line) taxol. Inset shows an example of one focal plane of GFP–H2B-labelled chromosomes stained with CREST antiserum to reveal the kinetochores. Bar = 2 µm, Mphase = metaphase.
None
Fig. 5. (A) In contrast to Mad2, retention of BubR1 at kinetochores depends on the presence of survivin. U2OS cells cotransfected with H2B–GFP (1 µg) and 10 µg pSuper (left panels) or pS-Survivin (right panels) were treated with nocodazole (N) or taxol (T) for 2 h and stained with antibodies against α-tubulin (a and b, g and h), BubR1 (c and d, i and j) or Mad2 (e and f, k and l). Transfected, mitotic cells were imaged by confocal microscopy, by analysis of H2B–GFP staining of DNA (column labelled H2B–GFP). For better colour contrast, H2B–GFP is depicted in blue (column labelled merge). (B) Survivin-depleted cells are blocked in mitosis when treated with spindle depolymerizing drugs. U2OS cells cotransfected with 1 µg spectrin–GFP and 10 µg pSuper (closed symbols) or pS-Survivin (open symbols) were synchronized with thymidine and harvested at the indicated time points after release from the block. Nocodazole (=noco) and vinblastine (=VB) were added immediately after thymidine release. PI staining was combined with intracellular staining for MPM-2 to quantify mitotic cells. One representative out of three independent experiments is shown. (C) U2OS cells cotransfected with 1 µg pBabe-puro and 10 µg pSuper or 10 µg pS-Survivin were synchronized with thymidine for 24 h in the presence of puromycin (2 µg/ml). Puromycin-selected cells were released and harvested 18 h after release from the block. Taxol and nocodazole were added immediately after release. Cyclin B/cdk1 kinase assays were performed using histone H1 as a substrate. Cell lysates were subjected to western blotting and blots were probed with an anti-survivin pAb. (D) U2OS cells cotransfected with 1 µg H2B–GFP and 10 µg pS-Survivin were synchronized and life imaging was started 12 h after release in the presence of nocodazole. H2B–GFP fluorescence is shown on top, while the corresponding DIC image is below. Numbers indicated in the lower left corner indicate the elapsed time (h:min) from the start of mitosis. (E) U2OS cells cotransfected with 1 µg spectrin–GFP and 10 µg pSuper or pS-BubR1 were synchronized with thymidine and harvested 18 h after release from the block. Taxol or nocodazole was added immediately after thymidine release. PI staining was combined with intracellular staining for MPM-2 to quantify mitotic cells.
None
Fig. 6. Survivin is required for a monastrol-induced spindle checkpoint arrest. (A and B) U2OS cells, grown on coverslips, were cotransfected with 1 µg GFP–H2B and 10 µg pSuper (left panel) or pS-Survivin (right panel), were synchronized with thymidine, released for 15 h while monastrol was added during the final hour of the release. (A) Coverslips were fixed and stained with the indicated Abs. (B) Number of cells with Mad2 localized to all kinetochores (Mad2 high), Mad2 localized to a few kinetochores (Mad2 low) or no Mad2 (Mad2 neg.). (C) U2OS cells cotransfected with 1 µg spectrin–GFP and 10 µg pSuper (closed symbols) or pS-Survivin (open symbols) were synchronized with thymidine and harvested at the indicated time points after release from the block. Taxol (=tax) or monastrol (=monastr) were added immediately after thymidine release. PI staining was combined with intracellular staining for MPM-2 to quantify mitotic cells. (D) Time-lapse analysis of survivin knockdown cells as described in Figure 5D, but now in the presence of monastrol.

Similar articles

Cited by

References

    1. Adams R.R., Wheatley,S.P., Gouldsworthy,A.M., Kandels-Lewis,S.E., Carmena,M., Smythe,C., Gerloff,D.L. and Earnshaw,W.C. (2000) INCENP binds the Aurora-related kinase AIRK2 and is required to target it to chromosomes, the central spindle and cleavage furrow. Curr. Biol., 10, 1075–1078. - PubMed
    1. Adams R.R., Carmena,M. and Earnshaw,W.C. (2001) Chromosomal passengers and the (aurora) ABCs of mitosis. Trends Cell Biol., 11, 49–54. - PubMed
    1. Biggins S. and Murray,A.W. (2001) The budding yeast protein kinase Ipl1/Aurora allows the absence of tension to activate the spindle checkpoint. Genes Dev., 15, 3118–3129. - PMC - PubMed
    1. Bolton M.A., Lan,W., Powers,S.E., McCleland,M.L., Kuang,J. and Stukenberg,P.T. (2002) Aurora B kinase exists in a complex with survivin and INCENP and its kinase activity is stimulated by survivin binding and phosphorylation. Mol. Biol. Cell, 13, 3064–3077. - PMC - PubMed
    1. Brummelkamp T.R., Bernards,R. and Agami,R. (2002) A system for stable expression of short interfering RNAs in mammalian cells. Science, 296, 550–553. - PubMed

Publication types

MeSH terms

Substances