. 2003 Jun 1;23(11):4717-25.
doi: 10.1523/JNEUROSCI.23-11-04717.2003.

Corollary discharge inhibition of ascending auditory neurons in the stridulating cricket

Affiliations

Corollary discharge inhibition of ascending auditory neurons in the stridulating cricket

James F A Poulet et al. J Neurosci. .

Erratum in

  • J Neurosci. 2003 Jul 9;23(14):6161-2

Abstract

Acoustically communicating animals are able to process external acoustic stimuli despite generating intense sounds during vocalization. We have examined how the crickets' ascending auditory pathway copes with self-generated, intense auditory signals (chirps) during singing (stridulation). We made intracellular recordings from two identified ascending auditory interneurons, ascending neuron 1 (AN1) and ascending neuron 2 (AN2), during pharmacologically elicited sonorous (two-winged), silent (one-winged), and fictive (isolated CNS) stridulation. During sonorous chirps, AN1 responded with bursts of spikes, whereas AN2 was inhibited and rarely spiked. Low-amplitude hyperpolarizing potentials were recorded in AN1 and AN2 during silent chirps. The potentials were also present during fictive chirps. Therefore, they were the result of a centrally generated corollary discharge from the stridulatory motor network. The spiking response of AN1 and AN2 to acoustic stimuli was inhibited during silent and fictive chirps. The maximum period of inhibition occurred in phase with the maximum spiking response to self-generated sound in a sonorously stridulating cricket. In some experiments (30%) depolarizing potentials were recorded during silent chirps. Reafferent feedback elicited by wing movement was probably responsible for the depolarizing potentials. In addition, two other sources of inhibition were present in AN1: (1) IPSPs were elicited by stimulation with 12.5 kHz stimuli and (2) a long-lasting hyperpolarization followed spiking responses to 4.5 kHz stimuli. The hyperpolarization desensitized the response of AN1 to subsequent quieter stimuli. Therefore, the corollary discharge will reduce desensitization by suppressing the response of AN1 to self-generated sounds.


Figures

Figure 1.
Figure 1.
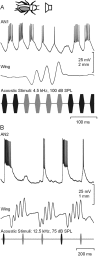
Responses of AN1 and AN2 to 4.5 and 12.5 kHz stimulation. Acoustic stimuli of 4.5 kHz elicit a burst of ∼4 spikes in AN1 (A), whereas at 80 dB SPL, 12.5 kHz stimuli cause a mix of excitation and inhibition in AN1 (B). Acoustic stimuli of 75 dB SPL, 4.5 kHz causes IPSPs in AN2 (C), whereas 75 dB SPL, 12.5 kHz stimuli elicit a burst of spikes (D). AN1,Intracellular recording of AN1; AN2, intracellular recording of AN2;Acoustic Stimuli, sound pulses.
Figure 2.
Figure 2.
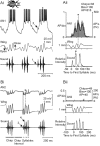
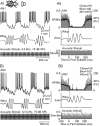
Activity of auditory neurons during sonorous singing. Ai, AN1 responded to the loud syllables (asterisk) produced during the chirp. The quieter sounds (arrow1) caused by wing opening generated a depolarizing potential (arrow 2), which occasionally elicited a spike. Wing opening and closing are marked at the side of the wing recording. Aii, The PST histogram and the overlaid, averaged spike frequency (top), averaged wing movement (middle), and rectified sound recording (bottom) show that the response of AN1 is in phase with sound production. The peak response of AN1 occurs during the closing wing movements and is indicated by a dashed line. Bi, AN2 was inhibited during sonorous chirps, an IPSP was generated in response to the initial quiet sound produced by opening wing movement (arrow 3) and in response to each loud sound generated during wing closing (arrow 4). Between each IPSP, AN2 rapidly repolarized (asterisk). A chirp, chirp interval, and syllables are marked below the recording. Bii, The PST histogram and overlaid spike frequency show that AN2 rarely spiked during sonorous stridulation. Crickets above the figures symbolize two-winged, one-winged, or fictive singing with or without ears (see Figs. 3, 4, 5, 6, 7, 8, 9, 10). Wing, Stridulatory wing movements; Sound, microphone recording; AP, Action potential.
Figure 3.
Figure 3.
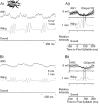
Low-amplitude hyperpolarizations were normally observed in both AN1 (Ai) and AN2 (Bi) during silent one-winged chirps. Superpositions of AN1 (Aii) and AN2 (Bii) (top traces), triggered by the onset of the wing movement (bottom traces), demonstrate the time course of the hyperpolarizations in relation to the average wing movement. They began just after the start of the closing wing movements, indicted by the dashed lines, and reached a maximum during the consecutive wing opening movements, indicated by the solid line. For additional details see Figure 2.
Figure 4.
Figure 4.
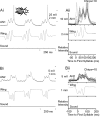
Ai, Bi, Depolarizations were sometimes observed in recordings of AN1 and AN2 during silent one-winged stridulation. Superimposed recordings of AN1 (Aii) and AN2 (Bii) together with the averaged wing movement and sound demonstrate the timing of the depolarizations in relation to the wing movement. The timing varied from animal to animal. In general, the depolarizations started during wing closing and peaked at the transition from closing to opening. The spikes have been truncated in the superpositions. For additional details see Figure 2.
Figure 5.
Figure 5.
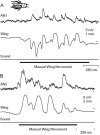
Response of AN1 and AN2 to wing movement in deafened crickets. EPSPs were elicited in AN1 (A) and AN2 (B) during manual wing movement in deafened crickets. For additional details see Figure 2.
Figure 6.
Figure 6.
Activity of AN1 and AN2 during fictive stridulation. Low-amplitude hyperpolarizations were recorded in AN1 (Ai) and AN2 (Bi) during the fictive chirps with the similar amplitude and timing as in silently stridulating crickets. Fictive chirps are indicated by thoracic motor activity. Aii, Bii, Superimposed traces of neuron recordings (top) show the timing of the PADs and IPSPs in relation to the averaged, rectified mesothoracic nerve 3A recording (bottom). Meso Nv 3A, Extracellular nerve recording with several units of opener and closer motor neuron activity. For additional details see Figure 2.
Figure 7.
Figure 7.
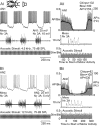
Response of AN1 and AN2 to acoustic stimuli during silent stridulation. Ai, The spiking response of AN1 to a train of sound pulses (4.5 kHz, 75 dB SPL, 7 msec duration, 15 msec interval) is inhibited during the chirps (asterisk). Aii, Quantitative analysis showing the PST histogram with the superimposed spike frequency (top), the averaged wing movement (middle), and the distribution of the sound stimuli (bottom) shows a clear inhibition of the response of AN1 during silent chirps. The inhibition began at the start of the first wing closing, as indicated by the dashed line. Bi, AN2 responded to a train of sound stimuli (12.5 kHz, 75 dB SPL, 7 msec duration, 15 msec interval) during the chirp intervals, but its response was inhibited during the chirps. EPSPs were recorded during the chirp (asterisk), and occasionally spikes were recorded on top of the larger EPSPs during the transition between closing and opening wing movement. Bii, Again the PST histogram and the average spike frequency of the response of AN2 show a clear reduction during the chirp that began at the start of wing closing, as indicated by the dashed line. The bottom PST histogram in Aii and Bii shows that the sound stimuli were evenly distributed throughout the chirp and the chirp interval. For additional details see Figure 2.
Figure 8.
Figure 8.
Auditory responses to acoustic stimulation during fictive singing. Ai, AN1 spiked to the sequence of 4.5 kHz, 75 dB SPL acoustic stimuli during the chirp interval, but was inhibited during the chirp.Aii,Inhibition during the chirp was clearly demonstrated by the PST histogram, with an overlaid average spike rate. Bi, The spiking response of AN2 to 12.5 kHz acoustic stimuli was inhibited during the fictive chirps but not during the chirp intervals. Bii, The PST histogram and overlaid average spike rate (top) of the response of AN2 to acoustic stimuli (bottom) show an inhibition of the response of AN2 during the fictive chirp, as indicated by the rectified and averaged motor activity (middle). For additional details see Figure 2.
Figure 9.
Figure 9.
Effectiveness of the centrally generated inhibition during silent stridulation. A, AN1 responded to 100 dB SPL, 4.5 kHz acoustic stimuli during the chirp intervals (black) with bursts of spikes. The strength of response was reduced during the chirps (gray). B, AN2 responded to 12.5 kHz, 75 dB SPL acoustic stimuli with bursts of spikes during the chirp interval (black). The response was reduced during the chirp (gray). For additional details see Figure 2.
Figure 10.
Figure 10.
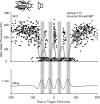
Timing of the centrally generated inhibition in AN1. The maximum spike frequency of AN1 to individual 4.5 kHz, 100 dB SPL stimuli presented during silent stridulation was plotted as a dot against the average wing movement. The gray line represents the average spike frequency. The close temporal relationship of responses near the temporal reference point at 0 sec is attributable to the analysis procedure. Gray bars show that the timing of the maximum response reduction during silent singing coincides with the opening wing movement, which is the time AN1 would respond to self-generated sound. For additional details see Figure 2.
Figure 11.
Figure 11.
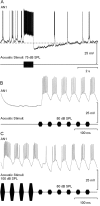
A, A long-lasting hyperpolarization that followed spiking of AN1 in response to a train of 4.5 kHz, 75 dB SPL stimuli. The dashed line indicates the resting membrane potential before acoustic stimulation. B, AN1 responded vigorously to a series of 4.5 kHz, 80 dB SPL stimuli. C, The response of AN1 to the 80 dB SPL stimuli was slightly reduced if they were preceded by 100 dB SPL chirps. For additional details see Figure 2.

References

    1. Bell CC ( 1981) An efference copy which is modified by reafferent input. Science 214: 450–453. - PubMed
    1. Bell CC ( 1982) Properties of a modifiable efference copy in an electric fish. J Neurophysiol 47: 1043–1056. - PubMed
    1. Bickmeyer U, Kalmring K, Halex H, Mucke A ( 1992) The bimodal auditory-vibratory system of the thoracic ventral nerve cord in Locusta migratoria (Acrididae, Locustinae, Oedipodini). J Exp Zool 264: 381–394. - PubMed
    1. Blakemore S-J, Wolpert DW, Frith CD ( 1998) Central cancellation of self-produced tickle sensation. Nat Neurosci 1: 635–640. - PubMed
    1. Bodznick D, Montgomery JC, Carey M ( 1999) Adaptive mechanisms in the elasmobranch hindbrain. J Exp Biol 202: 1357–1364. - PubMed

Publication types

LinkOut - more resources