Clinical Trial
. 2003 Jun 1;23(11):4726-36.
doi: 10.1523/JNEUROSCI.23-11-04726.2003.

Human theta oscillations related to sensorimotor integration and spatial learning

Affiliations
Clinical Trial

Human theta oscillations related to sensorimotor integration and spatial learning

Jeremy B Caplan et al. J Neurosci. .

Abstract

oscillations in the rat hippocampus have been implicated in sensorimotor integration (Bland, 1986), especially during exploratory and wayfinding behavior. We propose that human cortical activity coordinates sensory information with a motor plan to guide wayfinding behavior to known goal locations. To test this hypothesis, we analyzed invasive recordings from epileptic patients while they performed a spatially immersive, virtual taxi driver task. Consistent with this hypothesis, we found oscillations during both exploratory search and goal-seeking behavior and, in particular, during virtual movement, when sensory information and motor planning were both in flux, compared with periods of self-initiated stillness. oscillations had different topographic and spectral characteristics during searching than during goal-seeking, suggesting that different cortical networks exhibit depending on which cognitive functions are driving behavior (spatial learning during exploration vs orienting to a learned representation during goal-seeking). In contrast, oscillations in the beta band appeared to be related to simple motor planning, likely a variant of the Rolandic mu rhythm. These findings suggest that human cortical oscillations act to coordinate sensory and motor brain activity in various brain regions to facilitate exploratory learning and navigational planning.


Figures

Figure 1.
Figure 1.
Locations of recordings sites across all 12 participants. These topographic maps show electrode locations on four views of a standard brain. Top left, Right lateral view. Top right, Left lateral view. Bottom left, Inferior view. Bottom right, Mid-axial/hippocampal view. Different shapes denote locations in different participants. Unfilled sites were excluded from our analyses; filled sites were included (see Materials and Methods).
Figure 2.
Figure 2.
a, Sample screen shot from a first-person perspective. Participants viewed the environment in color. The road is textured gray, and grass is textured green, elevated from the road with a curb. A store (the “Java Zone”) is visible on the left, and other (non-store) buildings are also visible. The stone-textured wall that surrounds the town is visible in the distance. The participant's goal is indicated in the top left corner, and the score is indicated in the top right corner. b, A blue print of a sample environment layout (never seen by the participants). Note that there are three store blocks (light squares) and six building blocks (dark, unlabeled squares). The dark outline denotes the city wall.
Figure 3.
Figure 3.
a, A sample intracranial EEG trace. Letters indicate the participant's keystrokes (F, up arrow; L, left arrow;|, released a key). b, Wavelet power spectrum averaged across searching paths while virtually moving (solid plot) or standing still (dashed plot). c, Pepisode(f) for searching paths while moving and standing still. Error bars denote SEM. All three plots are taken from participant 2, left inferior temporal gyrus [Talairach coordinates (left–right, anterior–posterior, inferior–superior) =-22, 40, -16 mm].
Figure 4.
Figure 4.
Movement-relatedθ oscillations. Dark-filled shapes denote sites showing moreθ (4–8Hz) during movement than when standing still (two-tailedMann–WhitneyUtest;p<0.0001) while searching (a) or while goal-seeking (b). Light-filled shapes showed the opposite pattern. Unfilled shapes denote sites included in the analyses that failed to reach significance. Estimated type I error rate = 0.29 sites.
Figure 5.
Figure 5.
Movement-related β oscillations during searching (a) and goal-seeking (b). Dark-filled shapes denote sites showing more oscillations in the 13–30 Hz band during movement than when standing still (two-tailed Mann–Whitney U test; p < 0.0001). Light-filled shapes denote sites showing the opposite pattern. Unfilled shapes denote sites that did not show a significant effect. Estimated type I error rate = 0.29 sites. c, Pepisode(f) as a function of behavior during goal-seeking for an example site showing the effect [participant 6, Talairach coordinates (left–right, anterior–posterior, inferior–superior) = 52, -21, 52 mm]. Error bars denote SEM.
Figure 6.
Figure 6.
Movement-related γoscillations during searching (a) and goal-seeking (b). Dark-filled shapes denote sites showing more oscillations in the 31–45 Hz band during movement than when standing still (two-tailed Mann–Whitney U test; p < 0.0001). Light-filled shapes denote sites showing the opposite pattern. Unfilled shapes denote sites that did not show a significant effect. Estimated type I error rate = 0.18 sites. c, Pepisode(f) as a function of behavior during searching for an example site showing the effect [participant 1, Talairach coordinates (left–right, anterior–posterior, inferior–superior) =-38.2, 52.9, -20.3 mm]. Error bars denote SEM.
Figure 7.
Figure 7.
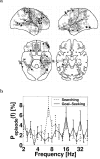
Type of search modulates oscillatory activity. a, Given that a site showed movement-relatedθ oscillations (4–8 Hz) during both searching and goal-seeking (p < 0.1), dark-filled shapes denote sites that showed higher levels of θ during searching than during goal-seeking (p < 0.01); light-filled shapes denote sites that showed the reverse effect. Estimated type I error rate = 12 sites. b, Pepisode(f) plot for searching (dashed plot) and goal-seeking (solid plot) for a site that showed this effect [participant 5, right fusiform gyrus, Talairach coordinates (left–right, anterior–posterior, inferior–superior) = 20, -52, -8 mm].
Figure 8.
Figure 8.
Resting posterior α rhythm. a, Sites that exhibit more α oscillations (8–12 Hz band) during eyes-closed periods (dark-filled sites) or during eyes-open periods (light-filled sites; two-tailed t test; p < 0.001). Estimated type I error rate = 0.12 sites. b, Example of a site showing this effect [participant 2, left medial temporal gyrus, Talairach coordinates (left–right, anterior–posterior, inferior–superior) =-62, -45, -2 mm]. Note a trend toward the opposite effect in theθ band, as commonly found in scalp recordings (Klimesch et al., 1993). Error bars denote SEM, with degrees of freedom corrected for the autocorrelation of the continuous wavelet transform. Power was used as the dependent measure instead of Pepisode(f), because there would have been too few observations to perform a statistically robust comparison.

References

    1. Adey WR, Dunlop CW, Hendrix CE ( 1960) Hippocampal slow waves: distribution and phase relationships in the course of approach learning. Arch Neurol 3: 96/74–112/90. - PubMed
    1. Adey WR, Walter DO, Lindsley DF ( 1962) Subthalamic lesions: effects on learned behavior and correlated hippocampal and subcortical slow-wave activity. Arch Neurol 6: 34–47. - PubMed
    1. Berger H ( 1929) Über das Elektroenkephalogramm des Menschen. Archiv für Psychiatrie und Nervenkrank 87: 527–570.
    1. Berry SD, Thompson RF ( 1978) Prediction of learning rate from the hippocampal electroencephalogram. Science 200: 1298–1300. - PubMed
    1. Bland BH ( 1986) The physiology and pharmacology of hippocampal formation theta rhythms. Prog Neurobiol 26: 1–54. - PubMed

Publication types

MeSH terms