. 2003 Jun;132(2):556-67.
doi: 10.1104/pp.103.021253.

Microarray analysis of the nitrate response in Arabidopsis roots and shoots reveals over 1,000 rapidly responding genes and new linkages to glucose, trehalose-6-phosphate, iron, and sulfate metabolism

Affiliations

Microarray analysis of the nitrate response in Arabidopsis roots and shoots reveals over 1,000 rapidly responding genes and new linkages to glucose, trehalose-6-phosphate, iron, and sulfate metabolism

Rongchen Wang et al. Plant Physiol. 2003 Jun.

Abstract

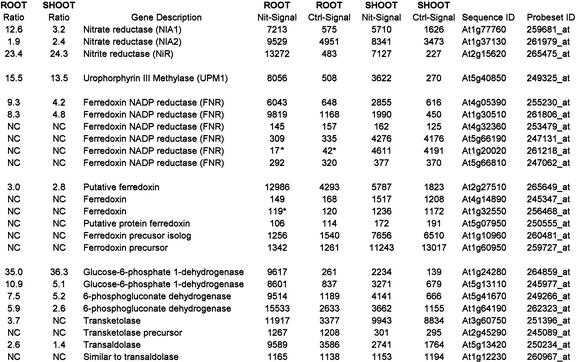
The genomic response to low levels of nitrate was studied in Arabidopsis using the Affymetrix ATH1 chip containing more than 22,500 probe sets. Arabidopsis plants were grown hydroponically in sterile liquid culture on ammonium as the sole source of nitrogen for 10 d, then treated with 250 microm nitrate for 20 min. The response to nitrate was much stronger in roots (1,176 genes showing increased or decreased mRNA levels) than in shoots (183 responding genes). In addition to known nitrate-responsive genes (e.g. those encoding nitrate transporters, nitrate reductase, nitrite reductase, ferredoxin reductase, and enzymes in the pentose phosphate pathway), genes encoding novel metabolic and potential regulatory proteins were found. These genes encode enzymes in glycolysis (glucose-6-phosphate isomerase and phosphoglycerate mutase), in trehalose-6-P metabolism (trehalose-6-P synthase and trehalose-6-P phosphatase), in iron transport/metabolism (nicotianamine synthase), and in sulfate uptake/reduction. In many cases, only a few select genes out of several in small gene families were induced by nitrate. These results show that the effect of nitrate on gene expression is substantial (affecting almost 10% of the genes with detectable mRNA levels) yet selective and affects many genes involved in carbon and nutrient metabolism.


Figures

Figure 1.
Figure 1.
Scatter plots of ATH1 array data. Plotted are signal intensities for roots (A) and shoots (B). Values are averaged from two biological replicates for nitrate-treated samples and chloride-treated (control) samples. Guide lines are given showing signal values of 100 and showing signal ratios of 1 (no change), 2 (induced), and –2 (repressed).
Figure 2.
Figure 2.
Numbers of induced/repressed genes in roots and shoots. Histogram pair shows the number of genes that were given a call of present (reliable signal intensity) for RNA samples from both biological replicates and had average ratios 2.0 and above and –2.0 and below. Note that the signal ratios were determined by the Affymetrix MAS software by comparing each probe pair on the induced array with the corresponding probe pair on the control array and, thus, are not simply the ratio of the average signal intensities shown in Figure 1. Bars above the 25 value correspond to values that were greater than 25 and were grouped together.
Figure 3.
Figure 3.
NRT family of genes. Shows average signal ratios and signal intensities for the NRT nitrate transporter gene families. Note that the signal ratios were determined by the Affymetrix MAS software by comparing each probe pair on the induced array with the corresponding probe pair on the control array and, thus, are not simply the ratio of the average signal intensities. NC, No change as determined by the Affymetrix MAS software. A value is given for the ratio only if both RNA samples had a call of I or D. An asterisk by a signal value indicates an “Absent” call.
Figure 4.
Figure 4.
Nitrate/nitrite assimilatory genes. Shows average signal ratios and signal intensities for NR, NiR, and genes involved in nitrite reduction, including those in the pentose phosphate pathway. An asterisk by a signal value indicates an “Absent” call.
Figure 5.
Figure 5.
Ammonium assimilatory genes. Shows average signal ratios and signal intensities for GS, GOGAT, and Asn synthetase (AS). An asterisk by a signal value indicates an “Absent” call.
Figure 6.
Figure 6.
Other metabolic genes. Shows average signal ratios and signal intensities for additional and novel metabolic and transporter genes. An asterisk by a signal value indicates an “Absent” call.
Figure 7.
Figure 7.
Potential regulatory genes. Pie charts showing the number of genes identified on the ATH1 array in one of several categories (transcription factors/DNA-binding proteins, protein kinase/phosphatases, response regulators, RING Zn finger proteins, and other) for (A) roots and (B) shoots showing 2.0-fold or greater induction or repression.
Figure 8.
Figure 8.
Comparison of real-time PCR and ATH1 array data. Histograms shows ATH1 signal ratios and quantitative real-time PCR ratios for select genes. The array data are averages of two biological replicates, and the error bar shows the spread between the two data points. The PCR data were obtained from two independent reactions for each biological replicate (total of four reactions) and averaged. Error bars = se. Ubiquitin 10 was used as the standard to normalize each sample. A, Induced genes involved in nitrate uptake and nitrate or nitrite reduction. B, Induced genes involved in trehalose-6-P synthesis.

Similar articles

Cited by

References

    1. Cheng C-L, Acedo GN, Dewdney J, Goodman HM, Cankling MA (1991) Differential expression of the two Arabidopsis nitrate reductase genes. Plant Physiol 96: 275–279 - PMC - PubMed
    1. Crawford NM (1995) Nitrate: nutrient and signal for plant growth. Plant Cell 7: 859–868 - PMC - PubMed
    1. Crawford NM, Glass ADM (1998) Molecular and physiological aspects of nitrate uptake in plants. Trends Plant Sci 3: 389–395
    1. Crawford NM, Kahn ML, Leustek T, Long SR (2000) Nitrogen and sulfur. In B Buchanan, W Gruissem, RL Jones, eds, Biochemistry and Molecular Biology of Plants. American Society of Plant Physiologists, Rockville, MD, pp 786–849
    1. Dennis DT, Blakeley SD (2000) Carbohydrate metabolism. In B Buchanan, W Gruissem, RL Jones, eds, Biochemistry and Molecular Biology of Plants. American Society of Plant Physiologists, Rockville, MD, pp 630–675

Publication types

MeSH terms