Comparative Study
. 2003 Jun;132(2):618-28.
doi: 10.1104/pp.103.021923.

Genomic comparison of P-type ATPase ion pumps in Arabidopsis and rice

Affiliations
Comparative Study

Genomic comparison of P-type ATPase ion pumps in Arabidopsis and rice

Ivan Baxter et al. Plant Physiol. 2003 Jun.

Erratum in

  • Plant Physiol. 2005 Jul;138(3):1807

Abstract

Members of the P-type ATPase ion pump superfamily are found in all three branches of life. Forty-six P-type ATPase genes were identified in Arabidopsis, the largest number yet identified in any organism. The recent completion of two draft sequences of the rice (Oryza sativa) genome allows for comparison of the full complement of P-type ATPases in two different plant species. Here, we identify a similar number (43) in rice, despite the rice genome being more than three times the size of Arabidopsis. The similarly large families suggest that both dicots and monocots have evolved with a large preexisting repertoire of P-type ATPases. Both Arabidopsis and rice have representative members in all five major subfamilies of P-type ATPases: heavy-metal ATPases (P1B), Ca2+-ATPases (endoplasmic reticulum-type Ca2+-ATPase and autoinhibited Ca2+-ATPase, P2A and P2B), H+-ATPases (autoinhibited H+-ATPase, P3A), putative aminophospholipid ATPases (ALA, P4), and a branch with unknown specificity (P5). The close pairing of similar isoforms in rice and Arabidopsis suggests potential orthologous relationships for all 43 rice P-type ATPases. A phylogenetic comparison of protein sequences and intron positions indicates that the common angiosperm ancestor had at least 23 P-type ATPases. Although little is known about unique and common features of related pumps, clear differences between some members of the calcium pumps indicate that evolutionarily conserved clusters may distinguish pumps with either different subcellular locations or biochemical functions.


Figures
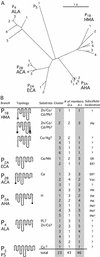
Figure 1.
Figure 1.
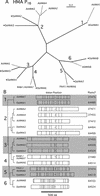
A, Phylogenetic tree showing 23 clusters of Arabidopsis and rice P-type ATPases. The tree was constructed by aligning full-length sequences with ClustalW, and then the Phylip programs protdist and fitch were used to create the tree. The major branches of the phylogenetic tree are named according to (Axelsen and Palmgren, 1998). B, Overview of plant P-type ATPases showing topology differences and ion specificities. Branches are designated from P1B to P5, with protein names underneath. The putative transported ions (substrates) are indicated. Boxes, Transmembrane segments; black circles, regulatory regions containing autoinhibitory sequences; white circles, HMA domains; black squares, CC dipeptide domains; white squares, poly-His domains. Cluster numbers correspond to the numbers found in the phylogenetic tree in A. For each cluster, the number of sequences in rice and Arabidopsis is indicated. If a subcellular location is known for a member of that group, it is noted in the right column. PM, Plasma membrane; Vac, vacuole.
Figure 2.
Figure 2.
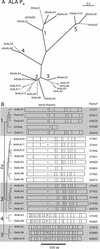
A, Phylogenetic tree of the P1B subfamily revealing six clusters. The tree was constructed from full-length protein sequences. Numbers denote clusters. Branches leading to the rice isoforms are thicker and the rice isforms are preceded by a bullet. The bootstrap values for OsHMA2 and OsHMA3 having a separate branch were 51/100 so they were collapsed to the nearest node. All other bootstrap values are greater than 98/100. B, Distributions of introns and exons in the P1B subfamily arranged in clusters. The phylogenetic tree used to define the clusters is taken from A but is shown in a different view. The genes are aligned around the phosphorylation site, [DKTGT], marked by a star. Phylogenetic tree branch lengths are not to scale but are included to show groupings.
Figure 3.
Figure 3.
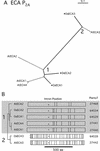
A, Phylogenetic tree of the P2A subfamily revealing two clusters. The tree was constructed from full-length protein sequences. Numbers denote clusters. Branches leading to the rice isoforms are thicker, and the rice isforms are preceded by a bullet. All bootstrap values are greater than 90/100. B, Distributions of introns and exons in the P2A subfamily arranged in clusters. The phylogenetic tree used to define the clusters is taken from A but is shown in a different view. The genes are aligned around the phosphorylation site, [DKTGT], marked by a star. Phylogenetic tree branch lengths are not to scale, but are included to show groupings.
Figure 4.
Figure 4.
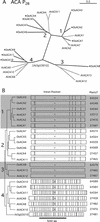
A, Phylogenetic tree of the P2B subfamily revealing four clusters. The tree was constructed from full-length protein sequences. Numbers denote clusters. Branches leading to the rice isoforms are thicker, and the rice isoforms are preceded by a bullet. All bootstrap values are greater than 71/100. An ACA-like protein is noted in brackets. B, Distributions of introns and exons in the P2B subfamily arranged in clusters. The phylogenetic tree used to define the clusters is taken from A but is shown in a different view. The genes are aligned around the phosphorylation site, [DKTGT], marked by a star. Phylogenetic tree branch lengths are not to scale but are included to show groupings. An ACA-like protein is listed by its Arabidopsis Genome Institute (AGI) number.
Figure 5.
Figure 5.
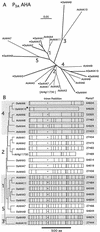
A, Phylogenetic tree of the P3A subfamily revealing five clusters. The tree was constructed from full-length protein sequences. Numbers denote clusters. Branches leading to the rice isoforms are thicker, and the rice isoforms are preceded by a bullet. The branching of OsAHA5 and 7 and AtAHA7 is ambiguous (bootstrap values 24/100), so the branches were collapsed to a common node. All other values are greater than 73/100. AHA-like protein is noted in brackets. B, Distributions of introns and exons in the P3A subfamily arranged in clusters. The phylogenetic tree used to define the clusters is taken from A but is shown in a different view. The genes are aligned around the phosphorylation site, [DKTGT], marked by a star. The position is marked on the scale below. Phylogenetic tree branch lengths are not to scale but are included to show groupings. An AHA-like protein is listed by its AGI number. OsAHA10+ is missing a C-terminal autoinhibitor domain.
Figure 6.
Figure 6.
A, Phylogenetic tree of the P4 subfamily revealing five clusters. The tree was constructed from full-length protein sequences. Numbers denote clusters. Branches leading to the rice isoforms are thicker, and the rice isoforms are preceded by a bullet. ALA-like gene is in brackets near the appropriate cluster. The bootstrap values for OsALA4 and OsALA5 having a separate branch were 43/100 so they were collapsed to the nearest node. The rest of the bootstrap values were greater than 76/100. B, Distributions of introns and exons in the P4 subfamily arranged in clusters. The phylogenetic tree used to define the clusters is taken from A but is shown in a different view. The genes are aligned around the phosphorylation site, [DKTGT], marked by a star. Phylogenetic tree branch lengths are not to scale but are included to show groupings. An ALA-like gene is noted by its PlantsT number.
Figure 7.
Figure 7.
Distributions of introns and exons in the P5 subfamily forming a single cluster. The genes are aligned around the phosphorylation site, [DKTGT], marked by a star.
Figure 8.
Figure 8.
GC gradient analysis reveals three Arabidopsis-like profiles in rice. GC content of DNA sequences was calculated using an in-house program called GeneGC (http://plantst.sdsc.edu/plantst/html/geneGC.shtml). The GC content was calculated in all of the full-length P-type ATPases in rice and Arabidopsis using a 121-bp sliding window that moved in steps of 51 bp. The GC content of the Arabidopsis sequences varies between 40% and 50%. The average of all the Arabidopsis genes is shown in B for comparison. All of the rice genes with 5′ gradients are shown in A. The genes in B do not have 5′ gradients and were classified as having high GC content or Arabidopsis-like “normal” GC content. Only the averages of the genes with high GC content are shown. Genes with unusual GC patterns have different markers.

References

    1. Altschul S, Gish W, Miller W, Myers E, Lipman D (1990) Basic local alignment search tool. J Mol Biol 215: 403–410 - PubMed
    1. Arango M, Gévaudant F, Oufattole M, Boutry M (2003) The plasma membrane proton pump ATPase: the significance of gene subfamilies. Planta 216: 355–365 - PubMed
    1. Axelsen KB, Palmgren MG (1998) Evolution of substrate specificities in the P-type ATPase superfamily. J Mol Evol 46: 84–101 - PubMed
    1. Axelsen KB, Palmgren MG (2001) Inventory of the superfamily of P-type ion pumps in Arabidopsis. Plant Physiol 126: 696–706 - PMC - PubMed
    1. Banuelos MA, Garciadeblas B, Cubero B, Rodriguez-Navarro A (2002) Inventory and functional characterization of the HAK potassium transporters of rice. Plant Physiol 130: 784–795 - PMC - PubMed

Publication types

Substances