. 2003 Sep-Oct;10(5):409-18.
doi: 10.1197/jamia.M1357. Epub 2003 Jun 4.

Design of a national retail data monitor for public health surveillance

Affiliations

Design of a national retail data monitor for public health surveillance

Michael M Wagner et al. J Am Med Inform Assoc. 2003 Sep-Oct.

Erratum in

  • Correction.
    [No authors listed] [No authors listed] J Am Med Inform Assoc. 2023 Dec 22;31(1):281. doi: 10.1093/jamia/ocad155. J Am Med Inform Assoc. 2023. PMID: 37757460 Free PMC article. No abstract available.

Abstract

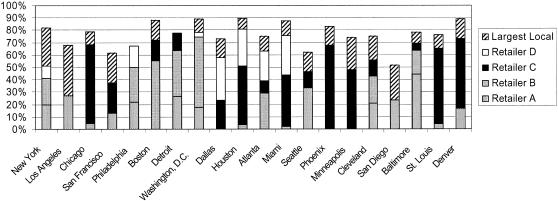
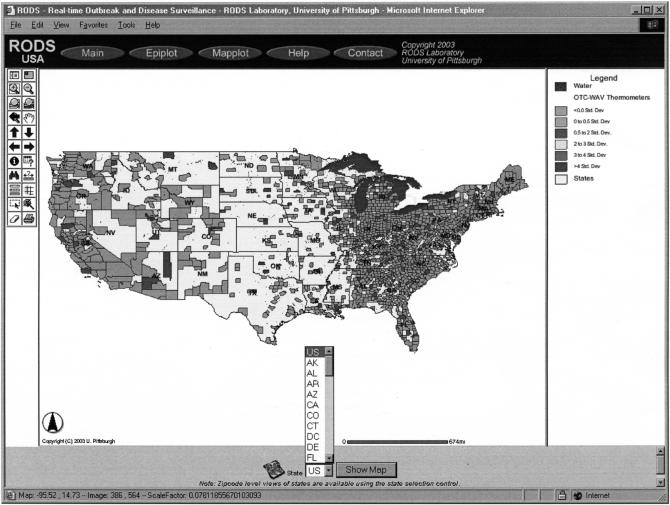
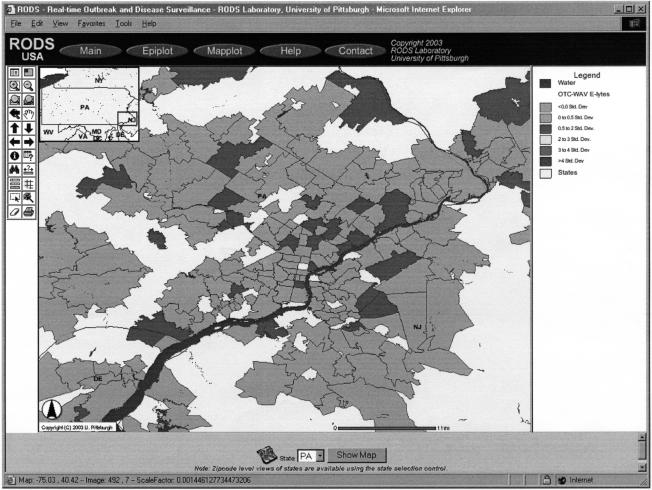
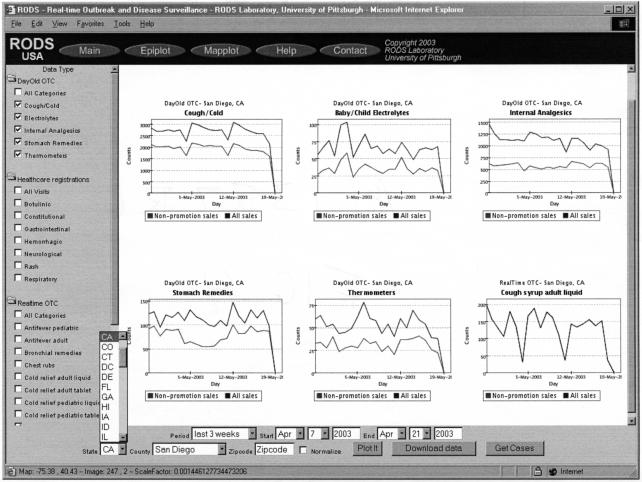
The National Retail Data Monitor receives data daily from 10,000 stores, including pharmacies, that sell health care products. These stores belong to national chains that process sales data centrally and utilize Universal Product Codes and scanners to collect sales information at the cash register. The high degree of retail sales data automation enables the monitor to collect information from thousands of store locations in near to real time for use in public health surveillance. The monitor provides user interfaces that display summary sales data on timelines and maps. Algorithms monitor the data automatically on a daily basis to detect unusual patterns of sales. The project provides the resulting data and analyses, free of charge, to health departments nationwide. Future plans include continued enrollment and support of health departments, developing methods to make the service financially self-supporting, and further refinement of the data collection system to reduce the time latency of data receipt and analysis.


Figures

Figure 1.
Figure 1.
Market share of over-the-counter (OTC) health care products of the four largest national retailers for the 20 most populated metropolitan areas in the United States. Also shown is the market share of the largest local retailer for each metropolitan area. The combination of the four national retailers and the largest local retailer provides 50% to 90% market share coverage for all cities. The four retailers do not necessarily correspond to retailers participating in this project. Source: Estimated from industry statistics using ACNielsen Scantrack, IRI Infoscan, and Racher Press Chain Drug Research.
Figure 2.
Figure 2.
National Retail Data Monitor: Sales of thermometers by county on May 17, 2003. This map summarizes data received from approximately 10,000 stores belonging to four national retail chains. The color green (the lighter shade) indicates that sales of thermometers on that day were within 0.5 standard deviations of expected, and the color blue (the darker shade) indicates sales were between 0.5 and 2.0 standard deviations.
Figure 3.
Figure 3.
National Retail Data Monitor: Sales of pediatric electrolytes in Philadelphia on May 17, 2003. The color coding indicates the level of sales of pediatric electrolytes for each zip code, relative to historical trends for that zip code. Most of the zip codes are colored green (the lighter shade) indicating that sales are within 0.5 standard deviations of expected. A few zip codes are colored blue (slightly darker shade), indicating sales are 0.5 to 2.0 standard deviations higher than expected. There are no clusterings of blue zip codes (or yellow, orange, or red areas) that would be indicative of more anomalous sales activity perhaps warranting investigation.
Figure 4.
Figure 4.
National Retail Data Monitor: Sales of six product categories in San Diego for a three-week period. This screen shows daily sales of five DayOld OTC product categories and the Cough syrup adult liquid Realtime OTC category (bottom right of screen). The upper line in each graph represents total sales and the lower, nonpromotional. A dip in Sunday sales of cough and cold products is visible. Users can view an arbitrary number of such graphs by checking the desired graphs on the list on the left of the screen and then clicking “Plot It.” At the bottom of the screen are controls for selecting the geographic region, time interval, and normalization (by total OTC sales). Controls also allow download of 30 days of data to a file for off-line analysis. The “Get Cases” function is not available for OTC sales data.

References

    1. Wagner M, Tsui F-C, Espino J, et al. The emerging science of very early detection of disease outbreaks. J Public Health Manag Pract. 2001;6(6):50–8. - PubMed
    1. Kaufmann A, Meltzer M, Schmid G. The economic impact of a bioterrorist attack: are prevention and postattack intervention programs justifiable? Emerg Infect Dis. 1997;3(2):83–94. - PMC - PubMed
    1. Lober WB, Karras BT, Wagner MM, et al. Roundtable on bioterrorism detection: information system-based surveillance. J Am Med Inform Assoc. 2002;9:105–15. - PMC - PubMed
    1. Tsui F-C, Espino JU, Dato VM, Gesteland PH, Hutman J, Wagner MM. Technical description of RODS: a real-time public health surveillance system. J Am Med Inform Assoc. 2003;10:399–408. - PMC - PubMed
    1. Talan DA, Moran GJ, Mower WR, et al. EMERGEncy ID NET: an emergency department-based emerging infections sentinel network. The EMERGEncy ID NET Study Group. Ann Emerg Med. 1998;32:703–11. - PubMed

Publication types

Substances