. 2003 Jul 15;550(Pt 2):529-34.
doi: 10.1113/jphysiol.2003.045674. Epub 2003 Jun 13.

EEG oscillations at 600 Hz are macroscopic markers for cortical spike bursts

Affiliations

EEG oscillations at 600 Hz are macroscopic markers for cortical spike bursts

Stuart N Baker et al. J Physiol. .

Erratum in

  • J Physiol. 2003 Aug 1;550(Pt 3):996

Abstract

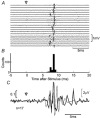
The human electroencephalogram (EEG) is generated predominantly by synchronised cortical excitatory postsynaptic potentials oscillating at frequencies <100 Hz. Unusually, EEG responses to electrical nerve stimulation contain brief bursts of high-frequency (600 Hz) wavelets. Here we show, in awake monkeys, that a subset of primary somatosensory cortex single units consistently fires both bursts and single spikes phase-locked to EEG wavelets. Spike bursts were also evoked by tactile stimuli, proving that this is a natural response mode. EEG wavelets at 600 Hz may therefore permit non-invasive assessment of population spike timing in human cortex.


Figures
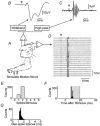
Figure 1
Figure 1. Example of recordings of epidural EEG and single-unit responses to median nerve stimulation
A, schematic of the experimental arrangement. B, average of epidural EEG triggered by median nerve stimulation (n = 1298), using a wideband filter setting (3 Hz to 2 kHz). C, the corresponding high-pass filtered average (428 Hz to 2 kHz). D, example single sweep responses of an S1 neuron. E, distribution of the number of response spikes per stimulus for this cell. F, peristimulus time histogram (n = 1298 stimuli). The grey-shaded region marks the period used to count the number of response spikes per stimulus, illustrated in E. G, inter-spike interval histogram. Arrows in BD mark the time of stimulus delivery.
Figure 2
Figure 2. Correspondence of single-unit responses with epidural averages
A, thick lines show summed peri-stimulus time histograms (PSTHs) over all units recorded in each animal (n = 17 units for monkey 33; n = 15 for monkey 32. Mean number of stimuli given per unit was 1128, range 150-2192). PSTHs have been normalised by dividing by the number of stimuli before addition in order to weight each neuron equally. Thin lines show a representative average of the epidural EEG (n = 1298 stimuli, monkey 33; n = 782 stimuli, monkey 32). Arrowheads mark the time of median nerve stimulation. B, the results of high-pass filtering the traces in A (>428 Hz).
Figure 3
Figure 3. Example of burst responses to natural tactile stimuli
A, the location of the cutaneous receptive field of the cell illustrated in Fig. 1. B, single-sweep responses of this cell to tap stimuli given to this region of skin using a stylus. Arrow marks the time of skin contact. C, distribution of the number of response spikes per stimulus. D, inter-spike interval histogram. E, peri-stimulus time histogram (n = 496 tap stimuli). The grey-shaded region indicates the period over which the number of response spikes was measured for C.
Figure 4
Figure 4. Single response spikes occur at preferred latencies after the stimulus
A, single-sweep responses of a neuron from monkey 32, which fired only one spike per stimulus in response to median nerve stimulation (arrow). B, peri-stimulus time histogram (PSTH), showing a bimodal distribution of response latencies. C, high-pass filtered summed PSTH of 17 cells that responded to nerve stimulation with only a single spike (thick line). This is overlain on a high-pass filtered average of the epidural EEG.

References

    1. Allison T, McCarthy G, Wood CC, Jones SJ. Potentials evoked in human and monkey cerebral cortex by stimulation of the median nerve. A review of scalp and intracranial recordings. Brain. 1991;114:2465–2503. - PubMed
    1. Baker SN, Lemon RN. Precise spatiotemporal repeating patterns in monkey primary and supplementary motor areas occur at chance levels. J Neurophysiol. 2000;84:1770–1780. - PubMed
    1. Baker SN, Philbin N, Spinks R, Pinches EM, Wolpert DM, MacManus DG, Pauluis Q, Lemon RN. Multiple single unit recording in the cortex of monkeys using independently moveable microelectrodes. J Neurosci Methods. 1999;94:5–17. - PubMed
    1. Baker SN, Pinches EM, Lemon SN. Synchronisation in monkey motor cortex during a precision grip task. II. Effect of oscillatory activity on corticospinal output. J Neurophysiol. 2003 (in the Press) - PubMed
    1. Baker SN, Spinks R, Jackson A, Lemon RN. Synchronization in monkey motor cortex during a precision grip task. I. Task dependent modulation in single-unit synchrony. J Neurophysiol. 2001;85:869–885. - PubMed

Publication types

LinkOut - more resources