. 2003 Jul;23(13):4687-700.
doi: 10.1128/MCB.23.13.4687-4700.2003.

Nova regulates GABA(A) receptor gamma2 alternative splicing via a distal downstream UCAU-rich intronic splicing enhancer

Affiliations

Nova regulates GABA(A) receptor gamma2 alternative splicing via a distal downstream UCAU-rich intronic splicing enhancer

B Kate Dredge et al. Mol Cell Biol. 2003 Jul.

Abstract

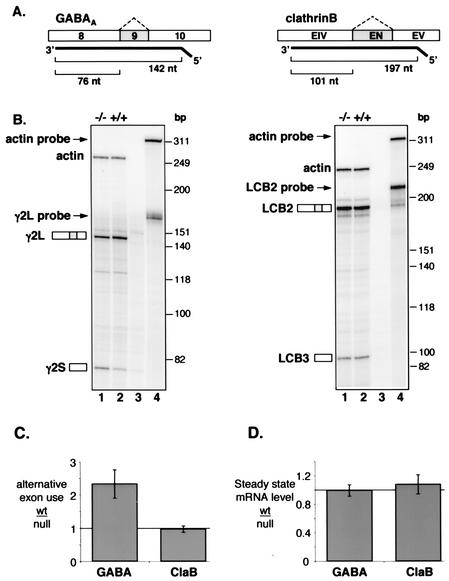
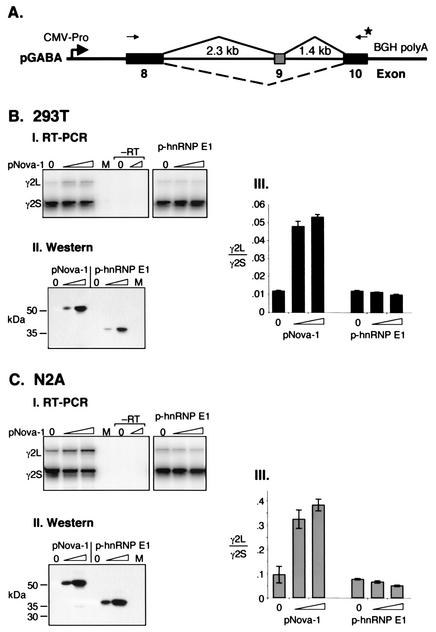
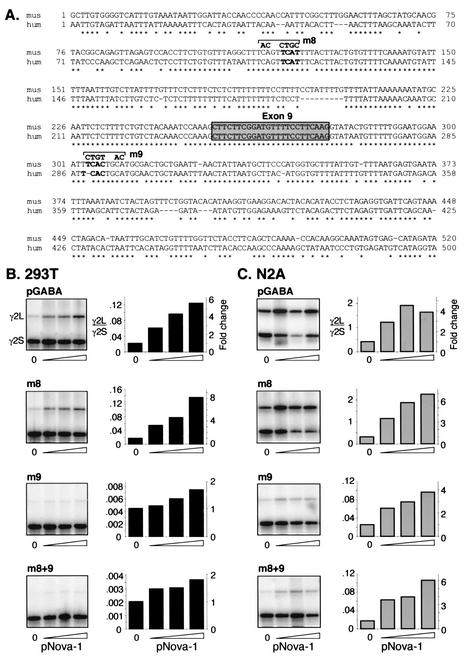
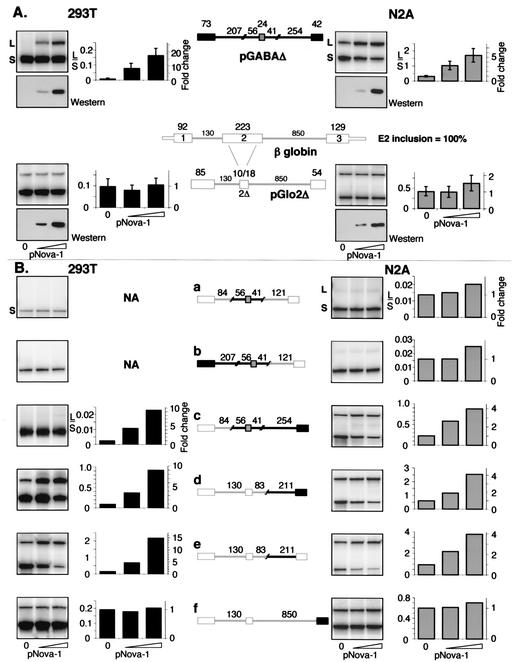
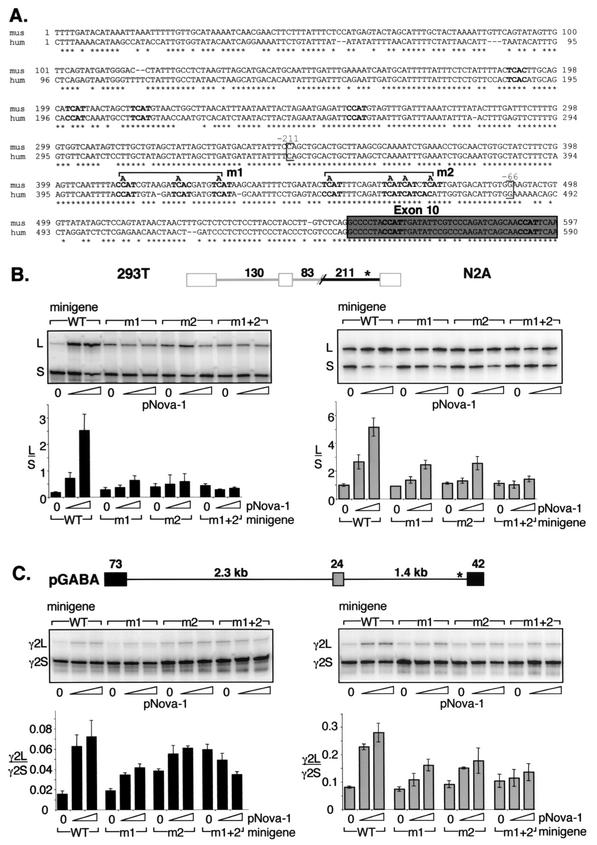
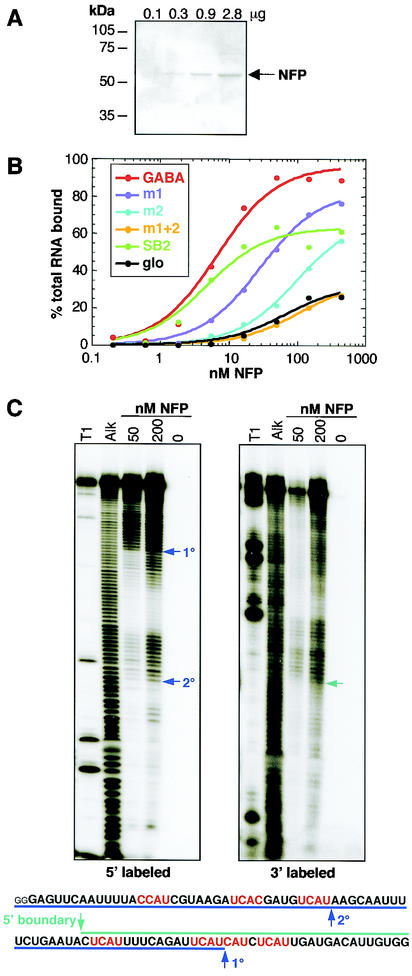
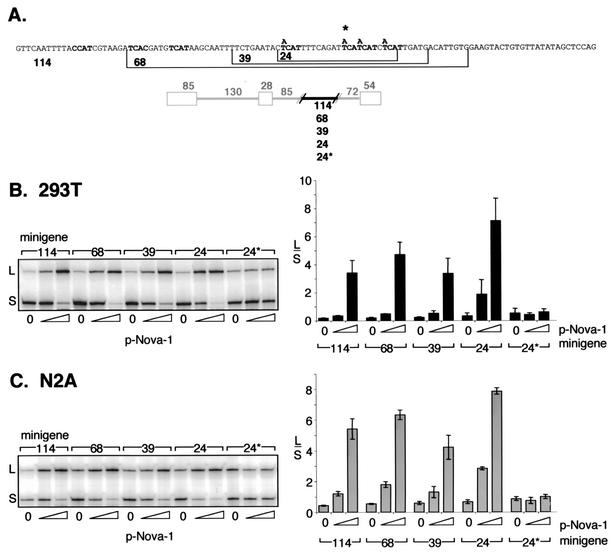
Nova is a neuron-specific RNA binding protein targeted in patients with the autoimmune disorder paraneoplastic opsoclonus-myoclonus ataxia, which is characterized by failure of inhibition of brainstem and spinal motor systems. Here, we have biochemically confirmed the observation that splicing regulation of the inhibitory GABA(A) receptor gamma2 (GABA(A)Rgamma2) subunit pre-mRNA exon E9 is disrupted in mice lacking Nova-1. To elucidate the mechanism by which Nova-1 regulates GABA(A)Rgamma2 alternative splicing, we systematically screened minigenes derived from the GABA(A)Rgamma2 and human beta-globin genes for their ability to support Nova-dependent splicing in transient transfection assays. These studies demonstrate that Nova-1 acts directly on GABA(A)Rgamma2 pre-mRNA to regulate E9 splicing and identify an intronic region that is necessary and sufficient for Nova-dependent enhancement of exon inclusion, which we term the NISE (Nova-dependent intronic splicing enhancer) element. The NISE element (located 80 nucleotides upstream of the splice acceptor site of the downstream exon E10) is composed of repeats of the sequence YCAY, consistent with previous studies of the mechanism by which Nova binds RNA. Mutation of these repeats abolishes binding of Nova-1 to the RNA in vitro and Nova-dependent splicing regulation in vivo. These data provide a molecular basis for understanding Nova regulation of GABA(A)Rgamma2 alternative splicing and suggest that general dysregulation of Nova's splicing enhancer function may underlie the neurologic defects seen in Nova's absence.


Figures

FIG. 1.
FIG. 1.
Changes in alternative splicing but not steady-state levels of GABAARγ2 transcripts in Nova-1 null mice. (A) Schematic representation of body-labeled antisense RNA probes used for RNase protection assays and the resulting product sizes used for quantitation. The cassette exons shown in grey are alternatively spliced, producing γ2L (contains exon 9) and γ2S (lacks exon 9) forms of the GABAARγ2 mRNA and LCB2 (contains exon EN) and LCB3 (lacks exon EN) forms of the ClaB mRNA (60). An antisense RNA probe specific for β-actin mRNA was also made. (B) Spinal cord RNA isolated from P9 (GABAARγ2 analysis) and P11 (ClaB) Nova-1 null mice (−/−) and their wild-type (+/+) littermates was analyzed by an RNase protection assay. Lanes 3, yeast RNA controls; lanes 4, undigested probes. (C and D) Quantitation of the data presented in panel B together with additional RNA samples (n = 5 littermate pairs). Products were quantitated by phosphorimager and corrected for the expected number of 32P-labeled uridines. (C) The ratio of long to short alternatively spliced products measured in control animals (wt) relative to the respective ratio for the corresponding Nova-1 null littermate. (D) For steady-state comparisons, the total of both alternatively spliced products was normalized to the amount of actin message detected in the same lane and compared between control animals (wt) and the corresponding Nova-1 null littermate. The solid bars represent the average changes in wild-type-null exon usage (C) or mRNA level (D); error bars represent standard deviations.
FIG. 2.
FIG. 2.
GABAARγ2L splicing is enhanced specifically by Nova-1 in heterologous cell lines. (A) Schematic representation of the GABAARγ2 (pGABA) minigene containing the full mouse intronic regions surrounding and including exon 9 plus shortened exons 8 and 10 constructed for transient transfection assays. The primers used for RT-PCR analysis are depicted as arrows; the star denotes the 32P-labeled primer. Figure is not to scale. (B and C) RNA was isolated from 293T (B) or N2A (C) cells transiently transfected with pGABA and increasing amounts of pNova-1 (0, 0.5, or 2.0 μg) or p-hnRNP E1 (0, 0.05, or 0.2 μg) mammalian expression plasmid and analyzed by RT-PCR. Mock transfections were performed using no plasmid DNA (lanes M). (Panels I) RT-PCRs were performed in duplicate using controls without RT, representatives of which are shown (−RT). (Panels II) Western blot using anti-T7-tagged antibody showing titration of T7-tagged Nova-1 and hnRNP E1 protein levels after transfection. (Panels III) Quantitation of the data presented in panels I plus two additional independent transfections (n = 3). The bars represent the ratios of γ2L/γ2S spliced products ± standard deviations.
FIG. 3.
FIG. 3.
Mutations within the adjacent intronic regions do not interfere with Nova's ability to regulate GABAARγ2 exon 9 alternative splicing. (A) Sequence comparisons of intronic regions surrounding GABAARγ2 exon 9. Genomic sequences surrounding and encompassing GABAARγ2 E9 (gray box) from human (hum) and mouse (mus) were aligned by ClustalW alignment (MacVector). Conserved YCAY elements are shown in boldface characters. m8 and m9 represent mutations made in the mouse minigene within introns 8 and 9, respectively. (B and C) The mutations depicted in panel A were made in pGABA, either individually or in combination, and the resulting minigenes were cotransfected with increasing amounts of pNova-1 (0, 0.5, 1.0, or 2.0 μg) into 293T (B) or N2A (C) cells. Spliced products were analyzed as described for Fig. 2. The graphs represent quantitation of the autoradiograph data shown in the left column of each panel; the left y axes indicate the ratios of γ2L/γ2S spliced products, and the right y axes indicate the severalfold changes in these ratios upon addition of pNova-1. Titration of transfected pNova-1 expression was monitored by Western blotting (data not shown). Similar results were obtained in at least two independent transfection experiments.
FIG. 4.
FIG. 4.
The intronic sequence upstream of GABAARγ2 E10 is sufficient for regulation of alternative splicing by Nova-1. (A) A truncated GABAARγ2 minigene (pGABAΔ) was generated by fusing intron deletion constructs (data not shown). A β-globin minigene (pGloΔ2) was derived from the human gene, with the central region of exon 2 deleted such that exon 2Δ retains 10 bp 5′ and 18 bp 3′ of the deletion site. The sizes (in base pairs) of the exonic and intronic sequences contained in the minigenes are noted above the schematics. Minigenes were cotransfected into 293T or N2A cells with increasing amounts of pNova-1 (0, 0.5, or 2.0 μg), and spliced products were measured by RT-PCR and phosphorimage analysis as described for Fig. 2. Titration of transfected pNova-1 expression was monitored by Western blotting using α-T7-tagged antibody (lower panel of each pair of panels). Quantitation of the data plus that of additional experiments (n = 4 for pGABAΔ, n = 5 for pGlo2Δ) is shown at the right side of each pair of panels. The bars represent L/S exon use ratios ± the standard deviations. (B) Chimeric constructs were made by ligating portions of the GABAARγ2 (black lines and filled boxes) and β-globin (gray lines and empty boxes) constructs shown in panel A. Minigenes were cotransfected into 293T or N2A cells with increasing amounts of pNova-1 (0, 0.5, or 2.0 μg), and spliced products were measured by RT-PCR by using primers specific for the outside exons and phosphorimage analysis as described for Fig. 2. The graphs represent quantitation of the autoradiograph data shown in the left column of each panel; the left y axes indicate the ratios of L/S spliced products, and the right y axes indicate the severalfold changes in these ratios upon addition of pNova-1. NA, not applicable (no long form detected). Titration of transfected pNova-1 expression was monitored by Western blotting (data not shown). Similar results were obtained in at least two independent transfection experiments.
FIG.5.
FIG.5.
Mutagenesis of the YCAY repeats close to E10 abolishes Nova-dependent regulation of GABAARγ2 minigene alternative splicing. (A) Genomic sequences upstream of GABAARγ2 exon 10 (gray box) from mouse (mus) and human (hum) were aligned by ClustalW alignment (MacVector). Conserved YCAY elements are shown in boldface characters. Brackets indicate the region corresponding to the in vitro transcribed RNA used as described for Fig. 6B and are numbered relative to exon 10. m1 and m2 represent mutations of three and four YCAY repeats to YAAY, respectively. (B) Chimeric minigenes containing the mutations depicted in panel A were cotransfected into 293T or N2A cells with increasing amounts of pNova-1 (0, 0.5, or 2.0 μg), and spliced products were measured by RT-PCR and phosphorimage analysis as described for Fig. 2. The transfected pNova-1 expression was monitored by Western blotting (data not shown). Quantitation of the data is shown below representative autoradiographs and is presented as L/S exon use ratios ± standard deviations for three independent transfections. WT, wild type. (C) GABAARγ2 minigenes containing the mutations depicted in panel A were cotransfected into 293T or N2A cells with increasing amounts of pNova-1 (0, 0.5, or 2.0 μg), and spliced products were measured by RT-PCR and phosphorimage analysis as described for Fig. 2. The transfected pNova-1 expression was monitored by Western blotting (data not shown). Quantitation of the data is shown below representative autoradiographs and is presented as γ2L/γ2S exon use ratios ± standard deviations for three independent transfections. WT, wild type.
FIG. 6.
FIG. 6.
Nova-1 binds with high affinity to GABAARγ2 RNA in vitro. (A) His-tagged NFP was expressed in Escherichia coli and purified over a nickel column. Aliquots of increasing concentrations were analyzed by sodium dodecyl sulfate-PAGE followed by staining with Coomassie stain. (B) Nitrocellulose filter binding assays were performed using the NFP shown in panel A and six RNAs transcribed in vitro. GABA, RNA corresponding to the region of GABAARγ2 intron 8 highlighted in Fig. 5, with the addition of the sequences GGGAG at the 5′ end and CUAGCAAA at the 3′ end derived from the PCR primers used to amplify the template prior to in vitro transcription; m1 and m2, mutations of three and four YCAY repeats to YAAY in GABA, respectively; SB2, RNA obtained by RNA selection with Nova-1 (6); glo, RNA derived from human β-globin which spans regions of exon 1 and intron 1 and contains no YCAY elements. (C) Mapping the boundaries of Nova-1 binding to GABAARγ2 intron 9 RNA. RNA was labeled with 32P at either the 5′ or 3′ end and subjected to mild alkaline hydrolysis (Alk). The RNA was then incubated with NFP at a final concentration of 50 or 200 nM, and protein:RNA complexes werecaptured by filtration through nitrocellulose filters. Bound RNAs were eluted and analyzed by denaturing PAGE. RNase T1 digestion (T1) was used to generate size standards. Boundaries are highlighted by arrows and indicated on the transcribed RNA sequence shown at the bottom of each panel. 1°, primary boundary; 2°, secondary boundary. Small letters represent sequences derived from primers.
FIG. 7.
FIG. 7.
A 24-nt intronic sequence is sufficient for regulation of alternative splicing by Nova-1 in a heterologous context. (A) DNA sequences derived from GABAARγ2 intron 9 contained within the chimeric minigenes used in panels B and C. Numbers specify the lengths (in base pairs) of the GABAARγ2 intronic regions cloned into the β-globin minigene. The star denotes the presence of four C-to-A mutations within the 24-nt GABAARγ2 sequence. (B and C) The chimeric minigenes depicted in panel A were cotransfected into 293T (B) or N2A (C) cells with increasing amounts (0, 0.5, or 2.0 μg) of pNova-1, and spliced products were measured by RT-PCR and phosphorimage analysis as described for Fig. 2. The titration of transfected pNova-1 expression was monitored by Western blotting (data not shown). Representative autoradiographs are shown at the left side of each panel; graphs summarize data from three independent transfections. The bars represent the ratios of L/S spliced products ± standard deviations.

Similar articles

Cited by

References

    1. Amara, S. G., V. Jonas, M. G. Rosenfeld, E. S. Ong, and R. M. Evans. 1982. Alternative RNA processing in calcitonin gene expression generates mRNAs encoding different polypeptide products. Nature 298:240-244. - PubMed
    1. Arning, S., P. Gruter, G. Bilbe, and A. Kramer. 1996. Mammalian splicing factor SF1 is encoded by variant cDNAs and binds to RNA. RNA 2:794-810. - PMC - PubMed
    1. Ashiya, M., and P. J. Grabowski. 1997. A neuron-specific splicing switch mediated by an array of pre-mRNA repressor sites: evidence of a regulatory role for the polypyrimidine tract binding protein and a brain-specific PTB counterpart. RNA 3:996-1015. - PMC - PubMed
    1. Berget, S. M. 1995. Exon recognition in vertebrate splicing. J. Biol. Chem. 270:2411-2414. - PubMed
    1. Bubunenko, M., T. L. Kress, U. D. Vempati, K. L. Mowry, and M. L. King. 2002. A consensus RNA signal that directs germ layer determinants to the vegetal cortex of Xenopus oocytes. Dev. Biol. 248:82-92. - PubMed

Publication types

MeSH terms