. 2003 Jun 24;100(13):7714-9.
doi: 10.1073/pnas.1332628100. Epub 2003 Jun 13.

Prediction and measurement of an autoregulatory genetic module

Affiliations

Prediction and measurement of an autoregulatory genetic module

Farren J Isaacs et al. Proc Natl Acad Sci U S A. .

Abstract

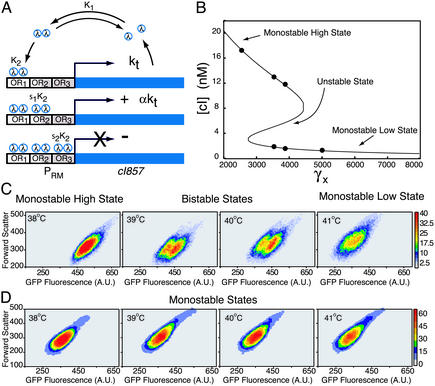
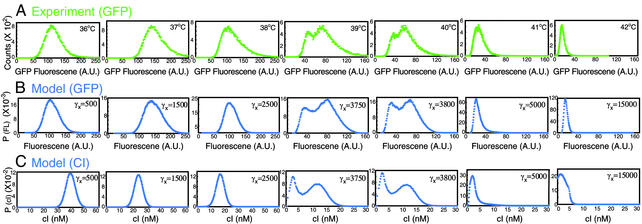
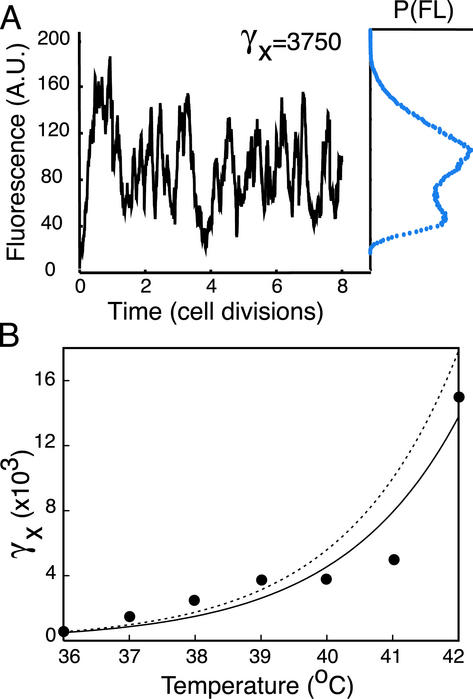
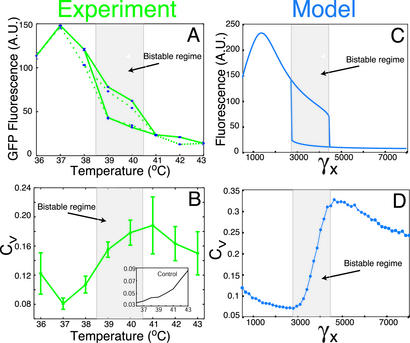
The deduction of phenotypic cellular responses from the structure and behavior of complex gene regulatory networks is one of the defining challenges of systems biology. This goal will require a quantitative understanding of the modular components that constitute such networks. We pursued an integrated approach, combining theory and experiment, to analyze and describe the dynamics of an isolated genetic module, an in vivo autoregulatory gene network. As predicted by the model, temperature-induced protein destabilization led to the existence of two expression states, thus elucidating the trademark bistability of the positive feedback-network architecture. After sweeping the temperature, observed population distributions and coefficients of variation were in quantitative agreement with those predicted by a stochastic version of the model. Because model fluctuations originated from small molecule-number effects, the experimental validation underscores the importance of internal noise in gene expression. This work demonstrates that isolated gene networks, coupled with proper quantitative descriptions, can elucidate key properties of functional genetic modules. Such an approach could lead to the modular dissection of naturally occurring gene regulatory networks, the deduction of cellular processes such as differentiation, and the development of engineered cellular control.


Figures

Fig. 1.
Fig. 1.
Autoregulatory network, theoretical predictions, and GFP-expression results. (A) The promoter region contains three operator sites, known as OR1–OR3. The cI857 gene expresses λ repressor (λ), which in turn dimerizes and binds to one of the three binding sites, OR1, OR2 [10-fold activation (29)], or OR3 (repression). (B) The nonlinearity of the governing model equation (see Modeling the Autoregulatory Module) leads to a bistable regime of the steady-state repressor concentration [cI] at specific model destabilization rates (γx). (C and D) Contour plots obtained from flow cytometry depict fluorescence in log-binned arbitrary units (A.U.) at varying temperatures. (C) Bistability is detected at 39 and 40°C in cultures of the autoregulatory network (pT2002b) containing the temperature-sensitive repressor (cI857). Bistability can be distinguished in the illustrated contour plots, whereas in GFP fluorescence distributions of the whole population we observed blurring between the high and low states. (D) Cultures containing the autoregulatory system (pT202b) with the wild-type cI gene maintain an activated monostable state.
Fig. 2.
Fig. 2.
Comparison of model and experiment over entire temperature and γx ranges. (A) GFP-expression histograms (green) expressed as linear values [in arbititrary units (A.U.)] from autoregulatory network cultures were filtered across narrow forward and side scatter to normalize for cell size and morphology and thus permit direct comparison to model. The simulations for GFP (B) and repressor (CI) (C) at increasing γx values are shown in blue.
Fig. 3.
Fig. 3.
(A) Model results for the time evolution of the fluorescence at an intermediate protein-destabilization value (γx = 3,750). The corresponding probability distribution is depicted at the end of the time series. A.U., arbititrary units. (B) Relationship between γx (model) and temperature (experiment). The best-fit exponential curve (solid line) for the data [γxαe0.55(T - 32)]is in close agreement with an exponential fit (broken line) obtained in a previous study (35) [γxαe0.58(T - 32)] (see Table 1 for parameter list).
Fig. 4.
Fig. 4.
Quantitative comparisons of experiment (A and B) and model (C and D). (A) Mean GFP expression versus temperature of three independent cultures of population distributions from Fig. 2 A. Cultures were initially grown at either a high (36°C, solid green line) or low (43°C, dotted green line) state and swept through a bistable regime to the alternate stable state. (B) The coefficient of variation (CV) as a function of temperature for three typical independent cultures is in agreement with the CV calculations obtained from the model (D). (Inset) CV for a strong constitutive promoter [positive control (see Methods)] is consistently low and distinct from the bistable autoregulatory network.

Similar articles

Cited by

References

    1. Hartwell, L. H., Hopfield, J. J., Leibler, S. & Murray, A. W. (1999) Nature 402, C47-C51. - PubMed
    1. Arnone, M. I. & Davidson, E. H. (1997) Development (Cambridge, U.K.) 124, 1851-1864. - PubMed
    1. Shen-Orr, S. S., Milo, R., Mangan, S. & Alon, U. (2002) Nat. Genet. 31, 64-68. - PubMed
    1. Lee, T. I., Rinaldi, N. J., Robert, F., Odom, D. T., Bar-Joseph, Z., Gerber, G. K., Hannett, N. M., Harbison, C. T., Thompson, C. M., Simon, I., et al. (2002) Science 298, 799-804. - PubMed
    1. Ptashne, M. (1992) A Genetic Switch: Phage λ and Higher Organisms (Cell Press & Blackwell Scientific, Cambridge, MA), 2nd Ed.

Publication types

Substances