

Effect of insulin on human skeletal muscle mitochondrial ATP production, protein synthesis, and mRNA transcripts
- PMID: 12808136
- PMCID: PMC164701
- DOI: 10.1073/pnas.1332551100
Effect of insulin on human skeletal muscle mitochondrial ATP production, protein synthesis, and mRNA transcripts
Abstract
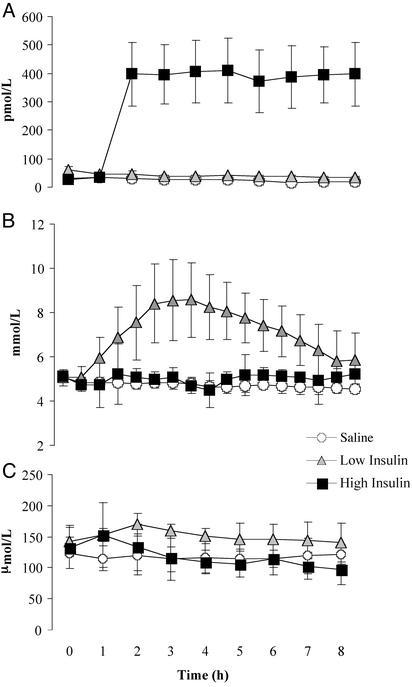
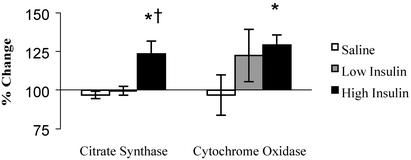
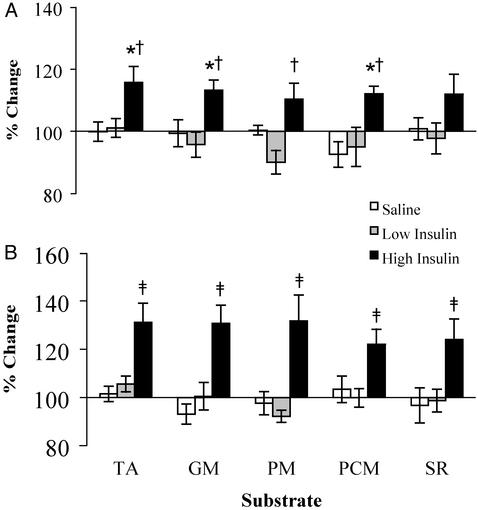
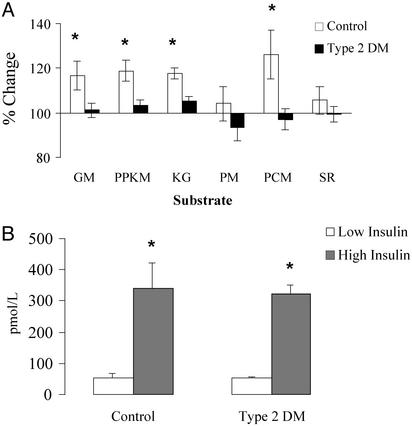
Mitochondria are the primary site of skeletal muscle fuel metabolism and ATP production. Although insulin is a major regulator of fuel metabolism, its effect on mitochondrial ATP production is not known. Here we report increases in vastus lateralis muscle mitochondrial ATP production capacity (32-42%) in healthy humans (P < 0.01) i.v. infused with insulin (1.5 milliunits/kg of fat-free mass per min) while clamping glucose, amino acids, glucagon, and growth hormone. Increased ATP production occurred in association with increased mRNA levels from both mitochondrial (NADH dehydrogenase subunit IV) and nuclear [cytochrome c oxidase (COX) subunit IV] genes (164-180%) encoding mitochondrial proteins (P < 0.05). In addition, muscle mitochondrial protein synthesis, and COX and citrate synthase enzyme activities were increased by insulin (P < 0.05). Further studies demonstrated no effect of low to high insulin levels on muscle mitochondrial ATP production for people with type 2 diabetes mellitus, whereas matched nondiabetic controls increased 16-26% (P < 0.02) when four different substrate combinations were used. In conclusion, insulin stimulates mitochondrial oxidative phosphorylation in skeletal muscle along with synthesis of gene transcripts and mitochondrial protein in human subjects. Skeletal muscle of type 2 diabetic patients has a reduced capacity to increase ATP production with high insulin levels.
Figures


References
-
- Cheng, A., Dube, N., Gu, F. & Tremblay, M. L. (2002) Eur. J. Biochem. 269, 1050-1059. - PubMed
-
- Sherratt, H. S. & Turnbull, D. M. (1990) Baillieres Clin. Endocrinol. Metab. 4, 523-560. - PubMed
-
- Ballinger, S. W. (1992) Nat. Genet. 1, 11-15. - PubMed
-
- Eriksson, K.-F. & Lindgarde, F. (1996) Diabetologia 39, 573-579. - PubMed
-
- Regensteiner, J. G., Sippel, J. M., McFarling, E. T., Wolfel, E. E. & Hiatt, W. R. (1995) Med. Sci. Sports Exercise 27, 875-881. - PubMed
Publication types
MeSH terms
Substances
Grants and funding
LinkOut - more resources
Full Text Sources
Medical
