. 2003 Jun 24;100(13):7737-42.
doi: 10.1073/pnas.1331931100. Epub 2003 Jun 13.

From latent disseminated cells to overt metastasis: genetic analysis of systemic breast cancer progression

Affiliations

From latent disseminated cells to overt metastasis: genetic analysis of systemic breast cancer progression

Oleg Schmidt-Kittler et al. Proc Natl Acad Sci U S A. .

Abstract

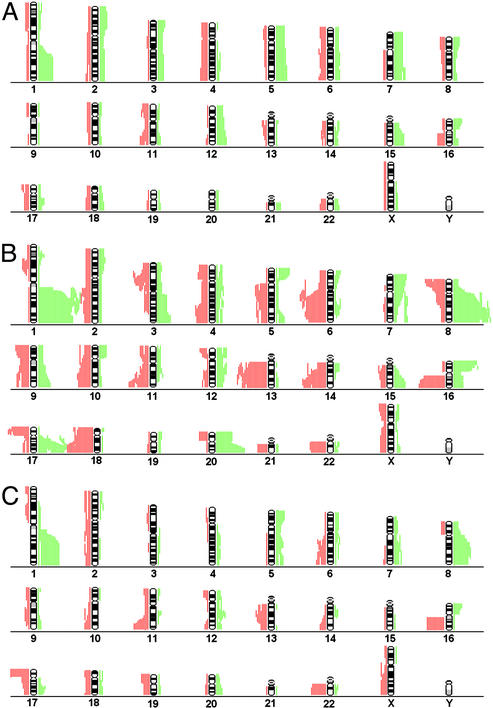
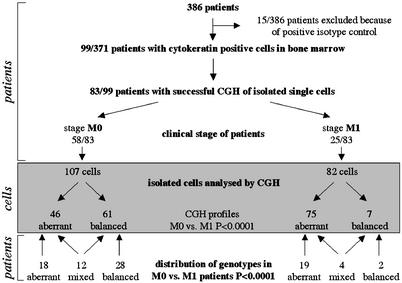
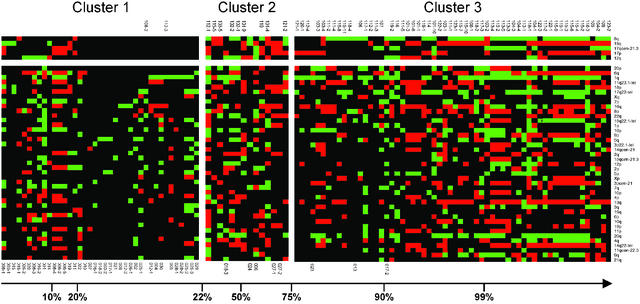
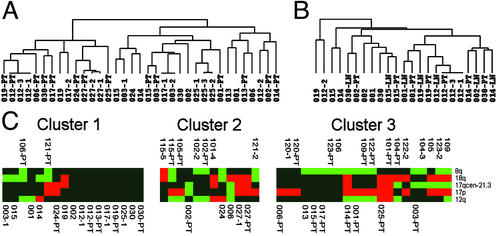
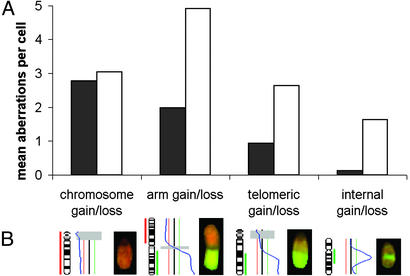
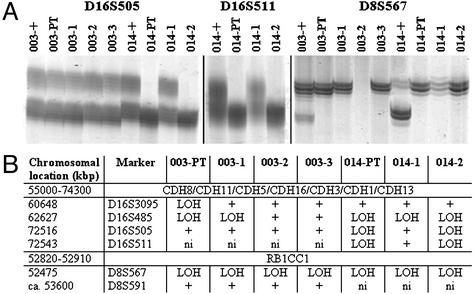
According to the present view, metastasis marks the end in a sequence of genomic changes underlying the progression of an epithelial cell to a lethal cancer. Here, we aimed to find out at what stage of tumor development transformed cells leave the primary tumor and whether a defined genotype corresponds to metastatic disease. To this end, we isolated single disseminated cancer cells from bone marrow of breast cancer patients and performed single-cell comparative genomic hybridization. We analyzed disseminated tumor cells from patients after curative resection of the primary tumor (stage M0), as presumptive progenitors of manifest metastasis, and from patients with manifest metastasis (stage M1). Their genomic data were compared with those from microdissected areas of matched primary tumors. Disseminated cells from M0-stage patients displayed significantly fewer chromosomal aberrations than primary tumors or cells from M1-stage patients (P < 0.008 and P < 0.0001, respectively), and their aberrations appeared to be randomly generated. In contrast, primary tumors and M1 cells harbored different and characteristic chromosomal imbalances. Moreover, applying machine-learning methods for the classification of the genotypes, we could correctly identify the presence or absence of metastatic disease in a patient on the basis of a single-cell genome. We suggest that in breast cancer, tumor cells may disseminate in a far less progressed genomic state than previously thought, and that they acquire genomic aberrations typical of metastatic cells thereafter. Thus, our data challenge the widely held view that the precursors of metastasis are derived from the most advanced clone within the primary tumor.


Figures

Fig. 2.
Fig. 2.
Chromosomal aberrations of disseminated tumor cells and primary tumors. Cumulative illustration of CGH aberrations for each chromosome of 40 disseminated tumor cells from 30 patients with minimal residual disease (A) and 47 single cells from 23 patients with clinical metastasis (B). The extension of each green or red bar depicts the chromosomal amplification or loss of an individual cell (or primary tumor), respectively. To depict the diversity of karyotypes retrieved from disseminated tumor cells and to avoid a bias in favor of patients with multiple cells, sister cells with identical CGH-profiles were excluded. (C) Chrormosomal aberrations of 27 matched primary tumors.
Fig. 1.
Fig. 1.
Flow diagram of sample preparation and analysis. Bone marrow samples of 386 breast cancer patients were screened for CK-positive cells. Stained cells were isolated and individually analyzed by CGH. The genomic characterization of cells from patients with (M1) and without (M0) manifest metastasis revealed significant differences between the two groups.
Fig. 3.
Fig. 3.
Identification of M0 and M1 genotypes. All cells were grouped on the basis of their probability of being isolated from a metastatic patient, ranging from 0.006 (Left) to 1.000 (Right). The five cluster-defining regions on top are shown in the order of the amount of information they provided to the classification (8q >18q >17qcen-21.3 > 17p >12q). All other genomic regions did not contribute to the classification and are ranked according to the feature-ranking analysis (see text). Gains and losses are indicated as green and red squares, respectively; balanced chromosomal regions are in black color. Chromosomal regions are shown (Right). Identifiers of metastastic patients (nos. 101–123) are depicted above the clusters, identifiers of nonmetastatic patients below (nos. 001–030). When several cells were isolated from one patient, they were labeled by an additional number.
Fig. 4.
Fig. 4.
Comparison of disseminated tumor cells with their matched primary tumors and lymph node metastasis. (A) Hierarchical clustering of primary tumors and their disseminated cells from patients in clinical stage M0. The applied algorithm (in complete linkage mode) organizes the CGH data on the basis of overall similarity in their genomic aberration patterns. The relationships are summarized in a dendrogram, in which the pattern and length of the branches reflect the relatedness of the samples. (B) Samples from seven patients in stage M0 and positive lymph nodes were analyzed for relatedness of primary tumors, lymph node metastasis, and disseminated tumor cells. (C) Twenty-four primary tumors and their descendent tumor cells were grouped in three clusters using the same classifier and probability thresholds as in Fig. 3. Identifiers of metastastic patients are depicted above the clusters, identifiers of nonmetastatic patients below. Patient identifiers for the disseminated cells are as in Fig. 3; primary tumors and lymph nodes samples are labeled PT and LN, respectively, after the patient identifier.
Fig. 5.
Fig. 5.
Types of chromosomal aberrations. (A) Mean number of chromosomal gains and losses per cell that affect the whole chromosome, a chromosome arm, a telomeric, or an internal fragment for M0 (black) and M1 (white) cells. (B) Example for each type of chromosomal aberration (on chromosome 14, 1, 13, and 17, from left to right) showing the ideogram and the respective hybridization picture.
Fig. 6.
Fig. 6.
LOH analysis of disseminated M0 cells and their primary tumors. LOH analysis for markers mapping within the cadherin cluster region or close to RB1CC1. (A) Polyacrylamide gel electrophoresis of the markers D16S505, D16S511, and D8S567 (“patient identifier”+, positive control from normal cells). (B) Summary of results obtained for all markers (+, informative marker and both alleles present; ni, marker not informative).

References

    1. Fearon, E. R. & Vogelstein, B. (1990) Cell 61, 759-767. - PubMed
    1. van't Veer, L. J., Dai, H., van de Vijver, M. J., He, Y. D., Hart, A. A., Mao, M., Peterse, H. L., van der Kooy, K., Marton, M. J., Witteveen, A. T., et al. (2002) Nature 415, 530-536. - PubMed
    1. Bernards, R. & Weinberg, R. A. (2002) Nature 418, 823. - PubMed
    1. Hanahan, D. & Weinberg, R. A. (2000) Cell 100, 57-70. - PubMed
    1. Abbruzzese, J. L., Abbruzzese, M. C., Hess, K. R., Raber, M. N., Lenzi, R. & Frost, P. (1994) J. Clin. Oncol. 12, 1272-1280. - PubMed

Publication types

MeSH terms