

Understanding folding and design: replica-exchange simulations of "Trp-cage" miniproteins
- PMID: 12808142
- PMCID: PMC164630
- DOI: 10.1073/pnas.1330954100
Understanding folding and design: replica-exchange simulations of "Trp-cage" miniproteins
Abstract
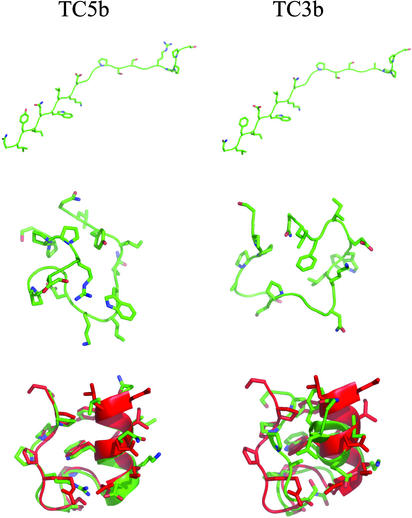
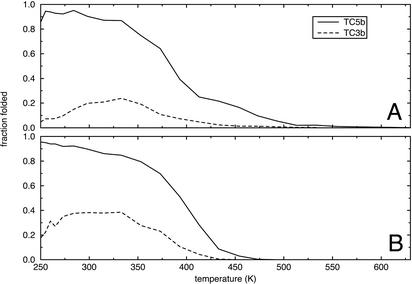
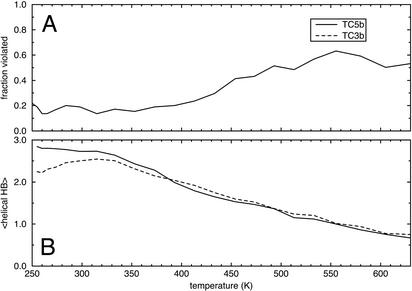
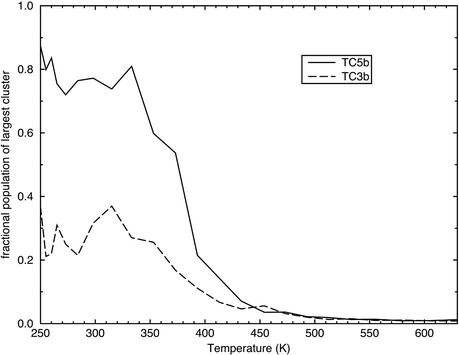
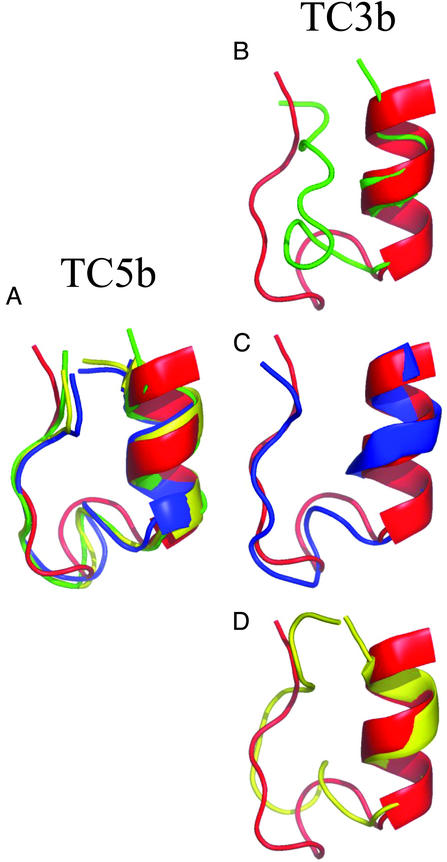
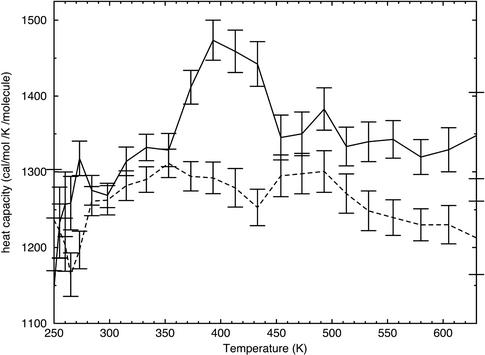
Replica-exchange molecular dynamics simulations in implicit solvent have been carried out to study the folding thermodynamics of a designed 20-residue peptide, or "miniprotein." The simulations in this study used the amber (parm94) force field along with the generalized Born/solvent-accessible surface area implicit solvent model, and they spanned a range of temperatures from 273 to 630 K. Starting from a completely extended initial conformation, simulations of one peptide sequence sample conformations that are <1.0 A Calpha rms positional deviation from structures in the corresponding NMR ensemble. These folded states are thermodynamically stable with a simulated melting temperature of approximately 400 K, and they satisfy the majority of experimentally observed NMR restraints. Simulations of a related mutant peptide show a degenerate ensemble of states at low temperature, in agreement with experimental results.
Figures
Similar articles
-
Trp-cage: folding free energy landscape in explicit water.Proc Natl Acad Sci U S A. 2003 Nov 11;100(23):13280-5. doi: 10.1073/pnas.2233312100. Epub 2003 Oct 27. Proc Natl Acad Sci U S A. 2003. PMID: 14581616 Free PMC article.
-
Replica exchange simulation of reversible folding/unfolding of the Trp-cage miniprotein in explicit solvent: on the structure and possible role of internal water.J Struct Biol. 2007 Mar;157(3):524-33. doi: 10.1016/j.jsb.2006.10.031. Epub 2006 Nov 26. J Struct Biol. 2007. PMID: 17293125
-
Folding simulations of Trp-cage mini protein in explicit solvent using biasing potential replica-exchange molecular dynamics simulations.Proteins. 2009 Aug 1;76(2):448-60. doi: 10.1002/prot.22359. Proteins. 2009. PMID: 19173315
-
Peptide folding simulations.Curr Opin Struct Biol. 2003 Apr;13(2):168-74. doi: 10.1016/s0959-440x(03)00040-x. Curr Opin Struct Biol. 2003. PMID: 12727509 Review.
-
Ligand docking simulations by generalized-ensemble algorithms.Adv Protein Chem Struct Biol. 2013;92:63-91. doi: 10.1016/B978-0-12-411636-8.00002-X. Adv Protein Chem Struct Biol. 2013. PMID: 23954099 Review.
Cited by
-
Improved Generalized Born Solvent Model Parameters for Protein Simulations.J Chem Theory Comput. 2013 Apr 9;9(4):2020-2034. doi: 10.1021/ct3010485. J Chem Theory Comput. 2013. PMID: 25788871 Free PMC article.
-
Applications of Molecular Dynamics Simulation in Structure Prediction of Peptides and Proteins.Comput Struct Biotechnol J. 2019 Jul 26;17:1162-1170. doi: 10.1016/j.csbj.2019.07.010. eCollection 2019. Comput Struct Biotechnol J. 2019. PMID: 31462972 Free PMC article. Review.
-
A strategy for reducing gross errors in the generalized Born models of implicit solvation.J Chem Phys. 2011 Apr 28;134(16):164104. doi: 10.1063/1.3578686. J Chem Phys. 2011. PMID: 21528947 Free PMC article.
-
Building a More Predictive Protein Force Field: A Systematic and Reproducible Route to AMBER-FB15.J Phys Chem B. 2017 Apr 27;121(16):4023-4039. doi: 10.1021/acs.jpcb.7b02320. Epub 2017 Apr 6. J Phys Chem B. 2017. PMID: 28306259 Free PMC article.
-
Simulations of a protein crystal: explicit treatment of crystallization conditions links theory and experiment in the streptavidin-biotin complex.Biochemistry. 2008 Nov 18;47(46):12065-77. doi: 10.1021/bi800894u. Epub 2008 Oct 25. Biochemistry. 2008. PMID: 18950193 Free PMC article.
References
-
- Neidigh, J. W., Fesinmeyer, R. M. & Andersen, N. H. (2002) Nat. Struct. Biol. 9, 425–430. - PubMed
-
- Neidigh, J. W., Fesinmeyer, R. M., Pricket, K. S. & Andersen, N. H. (2001) Biochemistry 40, 13188–13200. - PubMed
-
- Simmerling, C., Strockbine, B. & Roitberg, A. E. (2002) J. Am. Chem. Soc. 38, 11258–11259. - PubMed
-
- Wang, J. M., Cieplak, P. & Kollman, P. A. (2000) J. Comput. Chem. 21, 1049–1074.
MeSH terms
Substances
LinkOut - more resources
Full Text Sources
Other Literature Sources
