. 2003 Jun 16;197(12):1755-65.
doi: 10.1084/jem.20021659.

Multistep nature of microvascular recruitment of ex vivo-expanded embryonic endothelial progenitor cells during tumor angiogenesis

Affiliations

Multistep nature of microvascular recruitment of ex vivo-expanded embryonic endothelial progenitor cells during tumor angiogenesis

Peter Vajkoczy et al. J Exp Med. .

Abstract

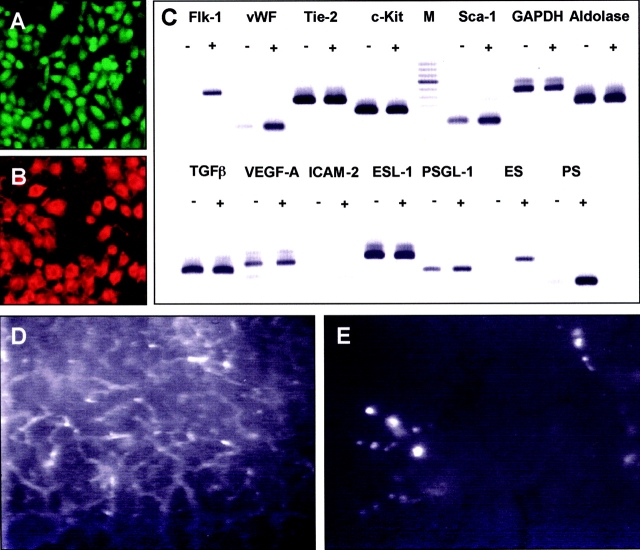
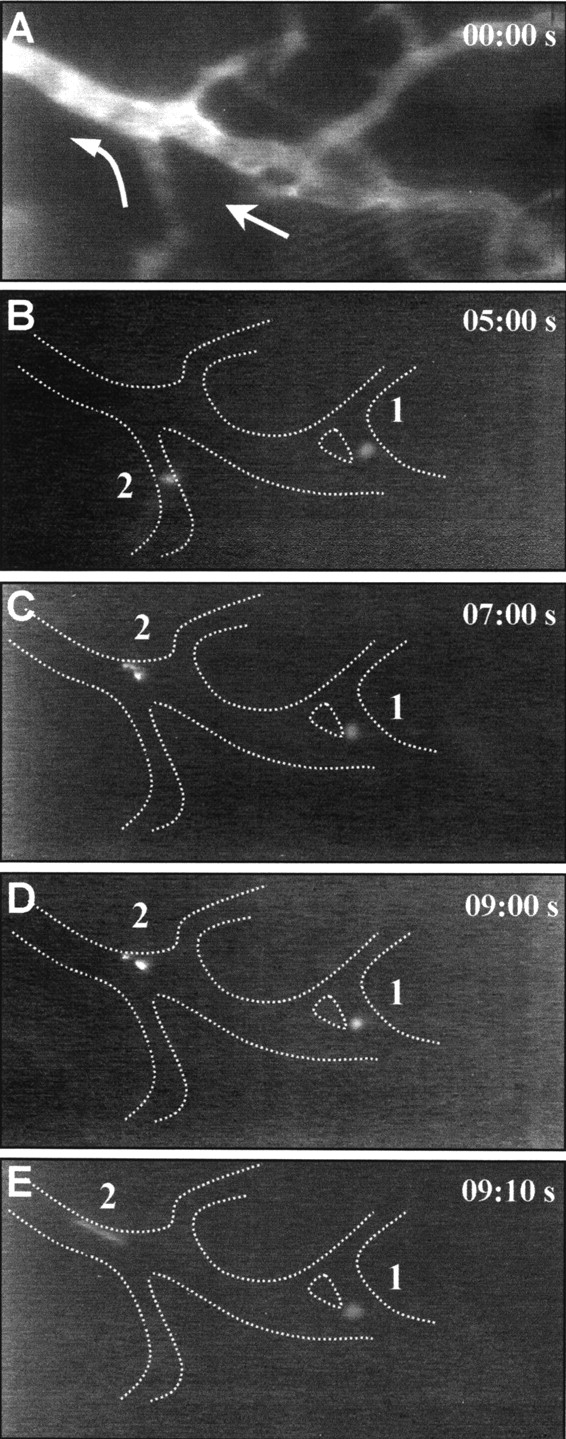
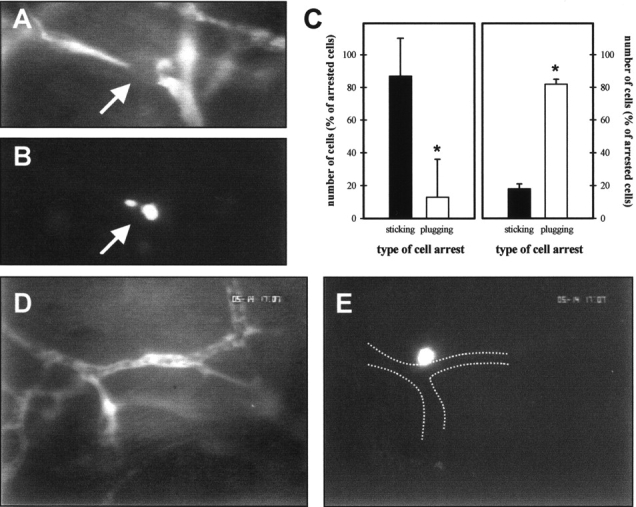
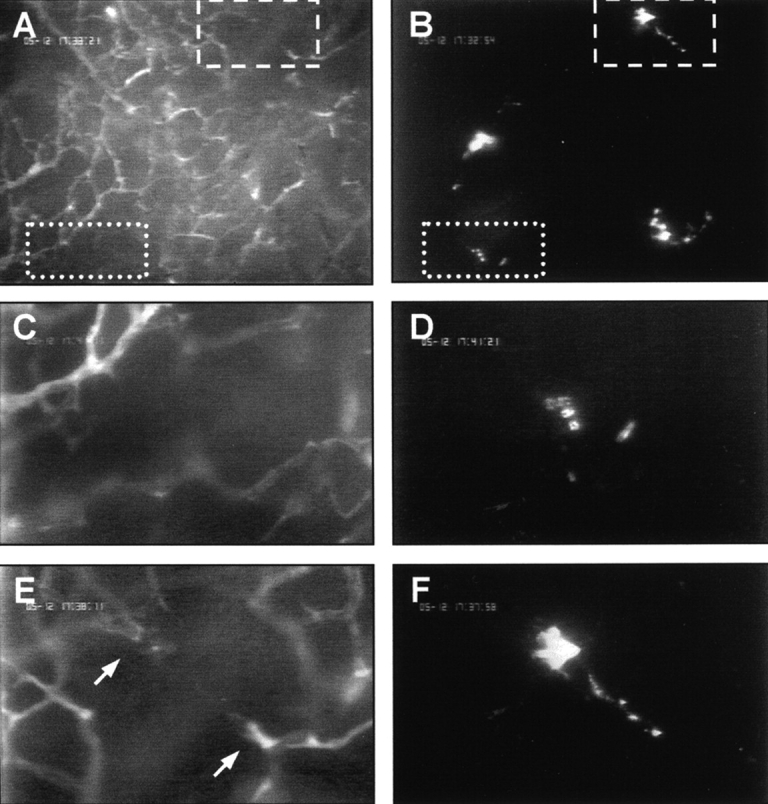
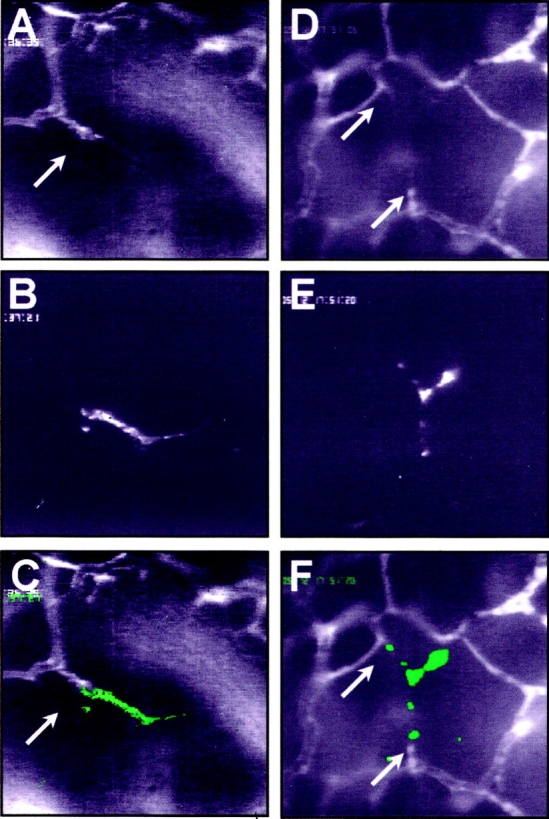
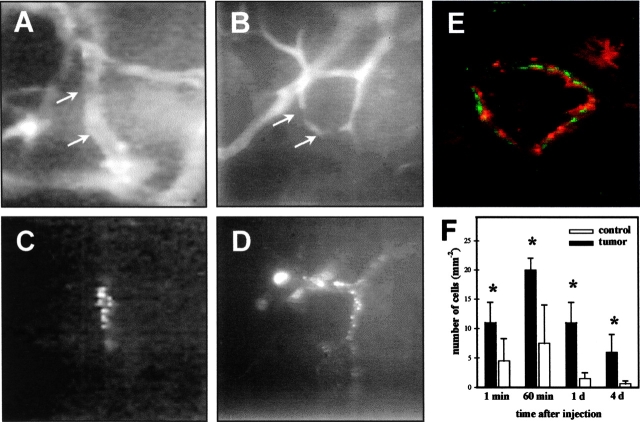
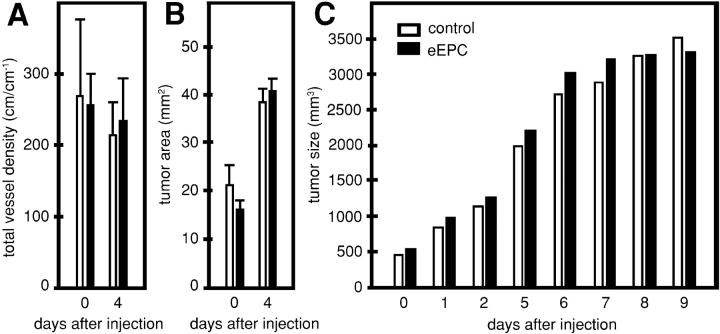
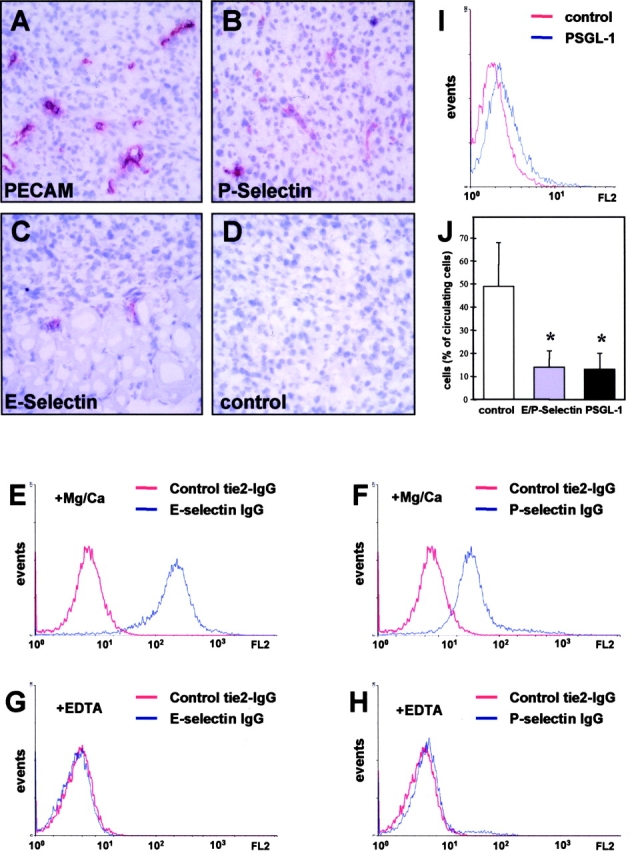
Tissue neovascularization involves recruitment of circulating endothelial progenitor cells that originate in the bone marrow. Here, we show that a class of embryonic endothelial progenitor cells (Tie-2+, c-Kit+, Sca-1+, and Flk-1-/low), which were isolated at E7.5 of mouse development at the onset of vasculogenesis, retain their ability to contribute to tumor angiogenesis in the adult. Using intravital fluorescence videomicroscopy, we further defined the multistep process of embryonic endothelial progenitor cell (eEPC) homing and incorporation. Circulating eEPCs are specifically arrested in "hot spots" within the tumor microvasculature, extravasate into the interstitium, form multicellular clusters, and incorporate into functional vascular networks. Expression analysis and in vivo blocking experiments provide evidence that the initial cell arrest of eEPC homing is mediated by E- and P-selectin and P-selectin glycoprotein ligand 1. This paper provides the first in vivo insights into the mechanisms of endothelial progenitor cell recruitment and, thus, indicates novel ways to interfere with pathological neovascularization.


Figures

Figure 1.
Figure 1.
eEPCs home to tumor angiogenic sites. (A and B) Ex vivo–expanded eEPCs labeled with EGFP (A) or DiI (B). (C) RNA expression profiles by RT-PCR analysis in eEPCs before (−) and after activation (+) with cAMP and retinoic acid. M: 100 bp ladder molecular weight marker. The stronger band is 800 bp. (D) Tumor microvasculature on day 10 after implantation after contrast enhancement with rhodamine G–conjugated dextran. (E) EGFP-eEPCs are arrested heterogeneously within the tumor microvasculature after intraarterial injection. Same region of interest as in D.
Figure 2.
Figure 2.
Circulating eEPCs interact with the tumor endo-thelium. (A) Tumor blood vessels before cell injection after contrast enhancement with FITC-conjugated dextran. Arrows indicate direction of microvascular blood flow. (B–E) Intravital microscopic sequence of two DiI-labeled eEPCs (1 and 2) interacting with the vessel wall of the identical vascular segment indicated in A. Cells adhere either permanently (1) or temporarily (2) to the endothelium. Numbers depict sequential time points in seconds (top right).
Figure 3.
Figure 3.
Mechanisms of eEPCs arrest in tumor and control tissue. (A and B) Narrow tumor blood vessel obliterated by plugging eEPC due to size restriction (arrows). Same region of interest in A and B. Tumor blood vessels and eEPCs are fluorescently marked as in Fig. 2. (C) Sticking versus plugging as mechanisms of eEPC arrest within tumor (left, n = 10 animals) and control (right, n = 4 animals) microvasculature. Control is chamber preparation without tumor implantation. Error bars show mean ± SD values. (D and E) Demonstration of eEPC migration through the endothelial lining within 1 h after intravascular arrest. Labeling of tumor blood vessels with rhodamine G–dextran (D) and of eEPCs with EGFP (E). Same region of interest in D and E. *, P < 0.05 versus control tissue.
Figure 4.
Figure 4.
Morphological changes of eEPCs after extravasation on day one after injection. (A and B) Multicellular clusters of DiI-labeled eEPCs are located extravascularly throughout the tumor. Same regions of interest in A and B. Squares indicate areas highlighted in (C) and (D, dotted line) and (E) and (F, dashed line). (C–F) Higher magnification of tumor blood vessels (C and E) and extravascular eEPCs (D and F). eEPCs either showed a round (D) or elongated shape and displayed bipolar morphology (F). Note the intimate relationship of cell to angiogenic vascular sprouts (arrows). Tumor microvasculature visualized after contrast enhancement by FITC-dextran.
Figure 5.
Figure 5.
Extravasated eEPCs branch and interconnect tumor blood vessels. (A and D) Tumor microvasculature after contrast enhancement by FITC-dextran. (B and E) Same regions of interest as in A and D, demonstrating DiI-labeled eEPCs. (C and F) Superimposed FITC and DiI images after adding false colors to DiI images. eEPCs are marked with green false color. (A–C) eEPCs participate in angiogenic sprouting (arrow indicates vascular sprout; day 1 after injection). (D–F) eEPCs branch and span between individual tumor blood vessels interconnecting distant microvascular segments (arrows indicate vascular sprouts; day 1 after injection).
Figure 6.
Figure 6.
Functional incorporation of eEPCs into the tumor microvasculature on day 4 after injection. (A and B) Tumor microvasculature after contrast enhancement by FITC-dextran. (C and D) Same regions of interest as in A and B, demonstrating DiI-labeled eEPCs that line perfused tumor blood vessels, indicating successful incorporation into the new tumor microvasculature (arrows). (E) Cryosections of tumor specimens stained with fluorescent antibodies against PECAM-1 (red), confirming the successful integration of EGFP-labeled eEPCs (green) into the endothelial lining of the tumor microvasculature. (F) Quantitative analysis of eEPCs within tumor (n = 9 animals) and control tissue (control is chamber preparation of normal tissue without tumor cell implantation; n = 4 animals). Error bars show mean ± SD values. *, P < 0.05 versus control tissue.
Figure 7.
Figure 7.
Effects of eEPC incorporation on tumor vascularization and tumor growth. Quantitative analysis of total vessel density (A) and tumor area (B) of C6 xenografts implanted into the skinfold chambers of nude mice. Measurements were performed in three to six regions of interest per tumor and per time point, before and 4 d after injection of eEPCs (eEPC, black bars; n = 6) or PBS (control, white bars; n = 5). Error bars show mean ± SD values. (C) Tumor growth curves for subcutaneous C6 xenografts implanted into the left flank regions of nude mice before and up to 9 d after injection of eEPCs (EPC, black bars; n = 4) or PBS (control, white bars; n = 4). Mean values are shown.
Figure 8.
Figure 8.
Interaction of eEPCs with tumor endothelium is mediated by selectins and PSGL-1. (A–D) Immunohistochemistry for PECAM-1 (A), P-selectin (B), E-selectin (C), and negative control (D) confirms P-selectin and E-selectin (the latter only in tumor periphery) expression by tumor endothelium. Tissue sections were counterstained with hematoxylin. (E–H) E- and P-selectins bind to eEPCs. Flow cytometry using an E-selectin IgG chimera (E) or a P-selectin IgG chimera (F) shows strong binding to eEPCs in the presence of Mg2+ and Ca2+ as compared with a tie2-IgG chimera control. The binding of both proteins is abolished in the presence of EDTA (G and H). (I) Flow cytometry demonstrates surface expression of the P-selectin ligand PSGL-1 in eEPCs. (J) Quantitative analysis of eEPC homing to tumor endothelium using intravital fluorescence videomicroscopy 10 min after cell injection and after blocking of PSGL-1, or P-selectin and E-selectin. n = 3 animals per experimental group. *, P < 0.05.

References

    1. Asahara, T., H. Masuda, T. Takahashi, C. Kalka, C. Pastore, M. Silver, M. Kearne, M. Magner, and J.M. Isner. 1999. Bone marrow origin of endothelial progenitor cells responsible for postnatal vasculogenesis in physiological and pathological neovascularization. Circ. Res. 85:221–228. - PubMed
    1. Asahara, T., T. Takahashi, H. Masuda, C. Kalka, D. Chen, H. Iwaguro, Y. Inai, M. Silver, and J.M. Isner. 1999. VEGF contributes to postnatal neovascularization by mobilizing bone marrow-derived endothelial progenitor cells. EMBO J. 18:3964–3972. - PMC - PubMed
    1. Takahashi, T., C. Kalka, H. Masuda, D. Chen, M. Silver, M. Kearney, M. Magner, J.M. Isner, and T. Asahara. 1999. Ischemia- and cytokine-induced mobilization of bone marrow-derived endothelial progenitor cells for neovascularization. Nat. Med. 5:434–438. - PubMed
    1. Kalka, C., H. Masuda, T. Takahashi, R. Gordon, O. Tepper, E. Gravereaux, A. Pieczek, H. Iwaguro, S.I. Hayashi, J.M. Isner, and T. Asahara. 2000. Vascular endothelial growth factor(165) gene transfer augments circulating endothelial progenitor cells in human subjects. Circ. Res. 86:1198–1202. - PubMed
    1. Kalka, C., H. Masuda, T. Takahashi, W.M. Kalka-Moll, M. Silver, M. Kearney, T. Li, J.M. Isner, and T. Asahara. 2000. Transplantation of ex vivo expanded endothelial progenitor cells for therapeutic neovascularization. Proc. Natl. Acad. Sci. USA. 97:3422–3427. - PMC - PubMed

Publication types

MeSH terms