. 2003 Jul;122(1):17-31.
doi: 10.1085/jgp.200208783. Epub 2003 Jun 16.

Calmodulin mediates Ca2+-dependent modulation of M-type K+ channels

Affiliations

Calmodulin mediates Ca2+-dependent modulation of M-type K+ channels

Nikita Gamper et al. J Gen Physiol. 2003 Jul.

Abstract

To quantify the modulation of KCNQ2/3 current by [Ca2+]i and to test if calmodulin (CaM) mediates this action, simultaneous whole-cell recording and Ca2+ imaging was performed on CHO cells expressing KCNQ2/3 channels, either alone, or together with wild-type (wt) CaM, or dominant-negative (DN) CaM. We varied [Ca2+]i from <10 to >400 nM with ionomycin (5 microM) added to either a 2 mM Ca2+, or EGTA-buffered Ca2+-free, solution. Coexpression of wt CaM made KCNQ2/3 currents highly sensitive to [Ca2+]i (IC50 70 +/- 20 nM, max inhibition 73%, n = 10). However, coexpression of DN CaM rendered KCNQ2/3 currents largely [Ca2+]i insensitive (max inhibition 8 +/- 3%, n = 10). In cells without cotransfected CaM, the Ca2+ sensitivity was variable but generally weak. [Ca2+]i modulation of M current in superior cervical ganglion (SCG) neurons followed the same pattern as in CHO cells expressed with KCNQ2/3 and wt CaM, suggesting that endogenous M current is also highly sensitive to [Ca2+]i. Coimmunoprecipitations showed binding of CaM to KCNQ2-5 that was similar in the presence of 5 mM Ca2+ or 5 mM EGTA. Gel-shift analyses suggested Ca2+-dependent CaM binding to an "IQ-like" motif present in the carboxy terminus of KCNQ2-5. We tested whether bradykinin modulation of M current in SCG neurons uses CaM. Wt or DN CaM was exogenously expressed in SCG cells using pseudovirions or the biolistic "gene gun." Using both methods, expression of both wt CaM and DN CaM strongly reduced bradykinin inhibition of M current, but for all groups muscarinic inhibition was unaffected. Cells expressed with wt CaM had strongly reduced tonic current amplitudes as well. We observed similar [Ca2+]i rises by bradykinin in all the groups of cells, indicating that CaM did not affect Ca2+ release from stores. We conclude that M-type currents are highly sensitive to [Ca2+]i and that calmodulin acts as their Ca2+ sensor.


Figures

F<sc>igure</sc> 1.
Figure 1.
Calmodulin confers high Ca2+ sensitivity to KCNQ2/3 channels. CHO cells were cotransfected with KCNQ2 and KCNQ3 alone (A) or together with wt CaM (B) or DN CaM (C). KCNQ2/3 currents were recorded from pulses delivered every 3 s while [Ca2+]i was simultaneously monitored from fluorescence of fura-2 (100 μM) loaded via the patch pipette. Plotted in the left panels in A–C are the current amplitudes (filled circles) and [Ca2+]i (red line), calculated as described in materials and methods. Bath solutions containing ionomycin (5 μM) in either the 2 mM or 0 Ca2+ solutions, or XE991 (50 μM) were applied during the periods indicated by the bars. Representative current traces are shown in the right-hand panels. In the inset is shown an immunoblot using an anti-CaM antibody of whole-cell lysates from CHO cells transfected with wt or DN CaM, run as Western gels in the presence of 2 mM Ca2+ or 1 mM EGTA. (D) The data for all experiments such as in A–C using non-CaM overexpressing (n = 9, open circles), wt (n = 10, closed circles) or DN CaM (n = 10, filled squares) overexpressing CHO cells were pooled and plotted as a dose-response curve of inhibition versus [Ca2+]i. For each experiment, the current and [Ca2+]i records were temporally aligned, [Ca2+]i was binned in 10 nM widths, and the current amplitudes within the appropriate time period were averaged. The current was normalized to the maximal current (Imax). The standard error for each bin in wt or DN CaM overexpressing cells is shown as the shaded region along the curve, and that for control cells as error bars. For wt CaM-expressing cells, the data were fitted by a Hill equation of the form (1 − I/Imax)*100% = a*[Ca2+]i n/(IC50 n + [Ca2+]i n), where a is the maximal current inhibition and n is the Hill coefficient with values given in the text. (E) Bars show the mean initial KCNQ2/3 current density measured at 0 mV for cells transfected only with KCNQ2+3 channels (Control, n = 14), or together with wt (n = 18) or DN CaM (n = 17), before application of the ionomycin-containing bath solutions. **, significance at the P ≤ 0.01 level, Student's t test.
F<sc>igure</sc> 2.
Figure 2.
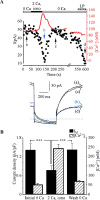
Modulation of M current in SCG neurons by [Ca2+]i. (A) SCG neurons were cultured for 48–72 h and simultaneous recording of M current and monitoring of [Ca2+]i performed. Fura-2 (100 μM) was loaded into the cells via the patch pipette. Plotted are the amplitudes of the deactivating time-dependent relaxations at −60 mV from pulses given every 3 s (black circles), and [Ca2+]i (red line), calculated from the fura-2 emission. Measurement was started in EGTA-buffered Ca2+-free solution, and solutions containing 2 mM Ca2+ plus 5 μM ionomycin or the M-current blocker linopirdine (LP, 50 μM) were applied during the periods indicated by the bars. The bottom panel shows representative current traces at the indicated times during the experiment. (B) Correlation of changes in [Ca2+]i (hatched columns) and M current amplitude (solid columns) induced by the application of the 2 Ca ionomycin solution (n = 9). ***, significance at the P ≤ 0.001 level, paired Student's t test.
F<sc>igure</sc> 3.
Figure 3.
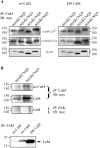
CaM coimmunoprecipitates with KCNQ2–5 channels. (A) CHO cells were transfected individually with myc-tagged KCNQ2–5 channels and either wt CaM or DN CaM, as indicated. Lysate proteins were immunoprecipitated in the presence of either 5 mM Ca2+ (top panels) or 5 mM EGTA (middle panels) with anti-CaM antibodies, the immunoprecipitates run as immunoblots and probed with anti-myc antibodies. The bottom panels show immunoblots using anti-myc antibodies from the same lysates as in the upper and middle panels, without immunoprecipitation. (B) CHO cells were transfected with myc-tagged KCNQ2 or KCNQ3 channels, either alone (top) or together with wt CaM (middle, lower). Lysate proteins were immunoprecipitated with either anti-CaM antibodies (top, middle), or anti-FAK antibodies (lower), the immunoprecipitates run as immunoblots and probed with anti-myc antibodies. The bottom panel is an immunoblot of lysates from CHO cells transfected with wt CaM, DN CaM, or no CaM, and probed with anti-CaM antibodies. We find that our anti-CaM antibodies have higher affinity for apoCaM than for Ca2+-bound CaM.
F<sc>igure</sc> 4.
Figure 4.
CaM interacts with an IQ-like domain in the carboxy terminus of KCNQ2 and KCNQ3. (A) Alignment of regions of KCNQ2–5 channels in the regions containing the IQ1 and IQ2 peptides tested in gel-shift assays. Below the alignment is the consensus sequence for residues with high similarity amongst KCNQ2–5. Yellow shading indicates completely conserved residues; green-shading indicates weakly conserved residues, and blue-shaded regions are consensus residues derived from a block of similar residues at a given position. The purple lines show the regions most “IQ-like” in these domains. (B) Gel shift assays. Shown are Comassie blue–labeled 15% nondenaturing Western gels of CaM incubated with IQ1 and IQ2 peptides of KCNQ2 (both KCNQ3 IQ1 peptides given in materials and methods gave the same negative result) and KCNQ3, and the IQ domain of the α1C Ca2+ channel (IQL) in the presence of 2 mM Ca2+ (left) or of 2 mM EGTA (right) in the sample and running buffers at CaM/peptide molar ratios indicated above each lane. The double arrows point to the position of CaM either alone, or bound to peptide.
F<sc>igure</sc> 5.
Figure 5.
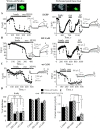
Bradykinin inhibition of SCG M current is mimicked or blocked by wt or DN CaM. M currents were recorded from cultured SCG neurons using the pulse protocol described in materials and methods. (A–C) Plotted on the panels are the amplitudes of the deactivating time-dependent relaxations at −60 mV from pulses given every 3 s for neurons exogenously expressed with EGFP alone (A), or together with DN CaM (B) or wt CaM (C) using two different expression methods and recording techniques. On the left are shown experiments using the Sinbis expression system and whole-cell recording, and on the right are shown experiments using the biolistic “gene gun” and perforated-patch recording (materials and methods). Bradykinin (250 nM), oxo-M (10 μM), XE991 (50 μM), or linopirdine (LP, 50 μM) were bath applied during the periods shown by the bars. Shown on the right of the panels are representative current traces at the indicated times from these experiments. In the inset are shown brightfield (left) or fluorescent (right) images of two SCG neurons transduced with the Sinbis method (left), or transfected with the gene gun method (right). A neuron in each case displays EGFP fluorescence, indicating successful transduction/transfection and were typical of those chosen for study. (D) Bars show mean inhibitions by bradykinin or oxo-M for cells transduced/transfected with EGFP alone (Control), or together with DN CaM or wt CaM. The solid bars summarize the Sinbis/whole-cell experiments and the hatched bars the gene gun/perforated-patch experiments. (E) Bars show mean initial M current density measured at −60 mV, normalized as pA/pF, for neurons transduced/transfected with EGFP only (Control), or together with DN CaM or wt CaM. ***, significance at the P ≤ 0.001; **, P ≤ 0.01; *, or P ≤ 0.05 levels, Student's t test.
F<sc>igure</sc> 6.
Figure 6.
Bradykinin-induced Ca2+ rises in SCG neurons are not disturbed by wt or DN CaM. Shown in A are 340/380 nm ratiometric records of fura-2 emission from SCG cells transduced with EGFP only (Control) or together with wt CaM or DN CaM using the Sinbis method. Fura-2 was bath loaded into SCG neurons as the AM ester for 30 min before the experiment. A high K+ bath solution (30 mM) was first applied (which raises [Ca2+]i and loads stores) several minutes before application of bradykinin (250 nM). The traces have been offset from each other for clarity. We did not calibrate [Ca2+]i in these experiments. (B) Bars show mean increases in the 340/380 nm ratio by bradykinin (n = 9, 13, and 14 for control, DN CaM, and wt CaM, respectively).

References

    1. Beech, D.J., L. Bernheim, A. Mathie, and B. Hille. 1991. Intracellular Ca2+ buffers disrupt muscarinic suppression of Ca2+ current and M current in rat sympathetic neurons. Proc. Natl. Acad. Sci. USA. 88:652–656. - PMC - PubMed
    1. Bernheim, L., D.J. Beech, and B. Hille. 1991. A diffusible second messenger mediates one of the pathways coupling receptors to calcium channels in rat sympathetic neurons. Neuron. 6:859–867. - PubMed
    1. Bernheim, L., A. Mathie, and B. Hille. 1992. Characterization of muscarinic receptor subtypes inhibiting Ca2+ current and M current in rat sympathetic neurons. Proc. Natl. Acad. Sci. USA. 89:9544–9548. - PMC - PubMed
    1. Bofill-Cardona, E., N. Vartian, C. Nanoff, M. Freissmuth, and S. Boehm. 2000. Two different signaling mechanisms involved in the excitation of rat sympathetic neurons by uridine nucleotides. Mol. Pharmacol. 57:1165–1172. - PubMed
    1. Brown, D.A., and P.R. Adams. 1980. Muscarinic suppression of a novel voltage-sensitive K+ current in a vertebrate neurone. Nature. 283:673–676. - PubMed

Publication types