

Epigenetic inactivation of CHFR in human tumors
- PMID: 12810945
- PMCID: PMC164671
- DOI: 10.1073/pnas.1337066100
Epigenetic inactivation of CHFR in human tumors
Abstract
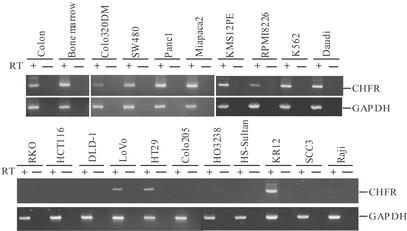
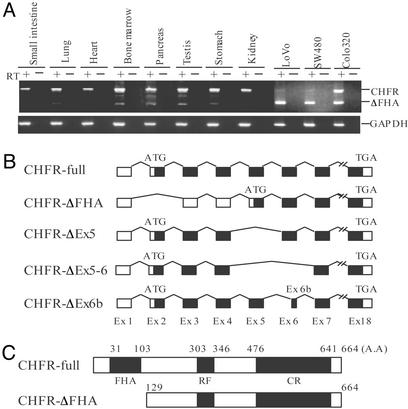
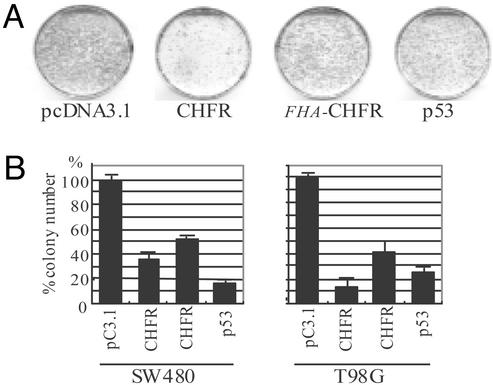
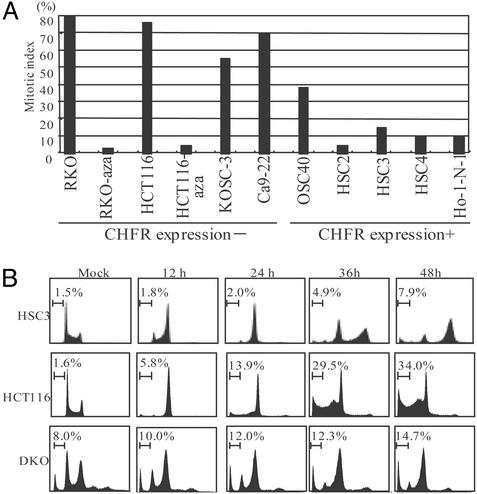
Cell-cycle checkpoints controlling the orderly progression through mitosis are frequently disrupted in human cancers. One such checkpoint, entry into metaphase, is regulated by the CHFR gene encoding a protein possessing forkhead-associated and RING finger domains as well as ubiquitin-ligase activity. Although defects in this checkpoint have been described, the molecular basis and prevalence of CHFR inactivation in human tumors are still not fully understood. To address this question, we analyzed the pattern of CHFR expression in a number of human cancer cell lines and primary tumors. We found CpG methylation-dependent silencing of CHFR expression in 45% of cancer cell lines, 40% of primary colorectal cancers, 53% of colorectal adenomas, and 30% of primary head and neck cancers. Expression of CHFR was precisely correlated with both CpG methylation and deacetylation of histones H3 and H4 in the CpG-rich regulatory region. Moreover, CpG methylation and thus silencing of CHFR depended on the activities of two DNA methyltransferases, DNMT1 and DNMT3b, as their genetic inactivation restored CHFR expression. Finally, cells with CHFR methylation had an intrinsically high mitotic index when treated with microtubule inhibitor. This means that cells in which CHFR was epigenetically inactivated constitute loss-of-function alleles for mitotic checkpoint control. Taken together, these findings shed light on a pathway by which mitotic checkpoint is bypassed in cancer cells and suggest that inactivation of checkpoint genes is much more widespread than previously suspected.
Figures


Similar articles
-
Promoter hypermethylation and silencing of CHFR mitotic stress checkpoint gene in human gastric cancers.Oncol Rep. 2004 Jul;12(1):129-33. Oncol Rep. 2004. PMID: 15201973
-
Epigenetic inactivation of CHFR in nasopharyngeal carcinoma through promoter methylation.Mol Carcinog. 2005 Aug;43(4):237-45. doi: 10.1002/mc.20106. Mol Carcinog. 2005. PMID: 15937956
-
Epigenetic inactivation of CHFR and sensitivity to microtubule inhibitors in gastric cancer.Cancer Res. 2003 Dec 15;63(24):8606-13. Cancer Res. 2003. PMID: 14695171
-
Epigenetics and miRNAs in human cancer.Adv Genet. 2010;70:87-99. doi: 10.1016/B978-0-12-380866-0.60004-6. Adv Genet. 2010. PMID: 20920746 Review.
-
[Advance of study on effects of Chfr gene of mitosis prophase checkpoint--review].Zhongguo Shi Yan Xue Ye Xue Za Zhi. 2004 Dec;12(6):870-4. Zhongguo Shi Yan Xue Ye Xue Za Zhi. 2004. PMID: 15631682 Review. Chinese.
Cited by
-
Extensive DNA methylation in normal colorectal mucosa in hyperplastic polyposis.Gut. 2006 Oct;55(10):1467-74. doi: 10.1136/gut.2005.082859. Epub 2006 Feb 9. Gut. 2006. PMID: 16469793 Free PMC article.
-
Structural basis of poly(ADP-ribose) recognition by the multizinc binding domain of checkpoint with forkhead-associated and RING Domains (CHFR).J Biol Chem. 2010 Dec 10;285(50):39348-58. doi: 10.1074/jbc.M110.159855. Epub 2010 Sep 29. J Biol Chem. 2010. PMID: 20880844 Free PMC article.
-
Colorectal cancer: a model for epigenetic tumorigenesis.Gut. 2007 Jan;56(1):140-8. doi: 10.1136/gut.2005.088799. Epub 2006 Jul 13. Gut. 2007. PMID: 16840508 Free PMC article. Review. No abstract available.
-
Upregulation of the checkpoint protein CHFR is associated with tumor suppression in pancreatic cancers.Oncol Lett. 2017 Dec;14(6):8042-8050. doi: 10.3892/ol.2017.7239. Epub 2017 Oct 20. Oncol Lett. 2017. PMID: 29344247 Free PMC article.
-
TOPK and PTEN participate in CHFR mediated mitotic checkpoint.Cell Signal. 2013 Dec;25(12):2511-7. doi: 10.1016/j.cellsig.2013.08.013. Epub 2013 Sep 3. Cell Signal. 2013. PMID: 24012691 Free PMC article.
References
-
- Lengauer, C., Kinzler, K. W. & Vogelstein, B. (1998) Nature 396, 643-649. - PubMed
-
- Michel, L. S., Liberal, V., Chatterjee, A., Kirchwegger, R., Pasche, B., Gerald, W., Dobles, M., Sorger, P. K., Murty, V. V. & Benezra, R. (2001) Nature 409, 355-359. - PubMed
-
- Cahill, D. P., Lengauer, C., Yu, J., Riggins, G. J., Willson, J. K., Markowitz, S. D., Kinzler, K. W. & Vogelstein, B. (1998) Nature 392, 300-303. - PubMed
-
- Jallepalli, P. V., Waizenegger, I. C., Bunz, F., Langer, S., Speicher, M. R., Peters, J. M., Kinzler, K. W., Vogelstein, B. & Lengauer, C. (2001) Cell 105, 445-457. - PubMed
-
- Scolnick, D. M. & Halazonetis, T. D. (2000) Nature 406, 430-435. - PubMed
Publication types
MeSH terms
Substances
LinkOut - more resources
Full Text Sources
Other Literature Sources
Molecular Biology Databases
