. 2003 Jul;33(7):1849-58.
doi: 10.1002/eji.200323148.

Exacerbation of experimental autoimmune encephalomyelitis in rodents infected with murine gammaherpesvirus-68

Affiliations

Exacerbation of experimental autoimmune encephalomyelitis in rodents infected with murine gammaherpesvirus-68

James W Peacock et al. Eur J Immunol. 2003 Jul.

Abstract

Viral infections have long been suspected to play a role in the pathogenesis of multiple sclerosis. In the present study, two different rodent models of experimental autoimmune encephalomyelitis (EAE) were used to demonstrate the ability of murine gammaherpesvirus-68 (gammaHV-68) to exacerbate development of neurological symptoms. SJL mice received UV-inactivated gammaHV-68 or intranasalgammaHV-68, followed by immunization against proteolipid-protein peptide 139-151. Infected mice became moribund within 10 days post-immunization, whereas mice exposed to UV-inactivated gammaHV-68 recovered. In the second model, Lewis rats were exposed to UV-inactivated gammaHV-68 or to gammaHV-68, followed by passive transfer of encephalitogenic T lymphocytes specific for myelin basic protein. Consistently, infected rats had higher clinical scores, and this result was observed during acute or latent gammaHV-68 infection. It is unlikely that this gammaHV-68-induced exacerbation was due to significant viral replication within the central nervous system since nested PCR, viral plaque assays, and infectious-centers assays demonstrated no detectable virus in spinal cords or brains of infected rodents undergoing EAE. Taken together, these studies demonstrate increased clinical symptoms of EAE in rodents infected by a gammaherpesvirus that has a limited ability to invade the central nervous system.


Figures

Figure 1
Figure 1
SJL mice infected with γHV‐68 show increased clinical scores and weight loss during immunization‐induced EAE. (A) Groups of SJL mice were exposed to UV‐inactivated γHV‐68 (closed squares, n=8) or infected with γHV‐68 (closed circles, n=10), 2 days prior to immunizing with PLP peptide 139–151. Control mice (closed triangles, n=4) were γHV‐68 infected, but immunized with an irrelevant peptide. An arrow indicates the day of immunization (i.e. day 0). Following immunization, mice were scored daily for the presence of clinical symptoms. Results are presented as mean clinical scores (± standard deviations) at the indicated times post‐immunization. (B) Mice were weighed daily and the percent decrease in body weight determined. Results are presented as mean body weights (± standard deviations). Asterisks indicate significant differences (p<0.01) when comparing γHV‐68‐infected mice versus mice treated with UV‐inactivated γHV‐68. These studies are representative of three separate experiments.
Figure 2
Figure 2
Absence of detectable γHV‐68 viral DNA in the CNS of SJL mice undergoing clinical EAE. Groups of SJL mice were exposed to UV‐inactivated γHV‐68 (γHV‐68 –) or infected with γHV‐68 (γHV‐68 +), and non‐immunized (EAE –) or immunized to induce EAE (EAE +) as indicated. Mice that were exposed to UV‐inactivated γHV‐68 or infected with γHV‐68, but non‐immunized (n=3), were killed at day 15 post‐infection, which represents the peak of leukocytosis. Mice infected and immunized to induce EAE (n=3) were killed at day 10 post‐infection, when mice had clinical scores between 2 and 3. After mice were killed, tissue from the spleen and spinal cord was taken and DNA extracted for PCR to amplify the genes encoding γHV‐68 gp150 or G3PDH. The number of PCR cycles used for each amplification is indicated. Results are presented as amplified PCR products electrophoresed on ethidium‐bromide‐stained agarose gels. These studies were performed twice with similar results.
Figure 3
Figure 3
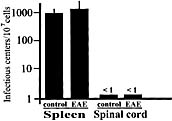
Absence of detectable latent γHV‐68 virus in the CNS of SJL mice undergoing clinical EAE. Groups of SJL mice were infected with γHV‐68, and non‐immunized (control, n=4) or immunized (EAE, n=4) as indicated. Mice were killed at day 10 post‐infection, when mice had clinical scores between 2 and 3, and tissue from the spleen and spinal cord were taken. Cells were isolated from each tissue and used to quantify the amount of latent virus using an infectious‐centers assay. Results are presented as mean virus counts per 107 cells (± standard deviations). A score of <1 indicates that the presence of any latent virus was below the level of detectability of this assay. These studies were performed twice with similar results.
Figure 4
Figure 4
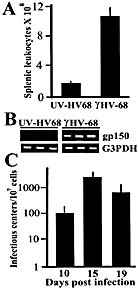
γHV‐68 infection induces leukocytosis and establishes viral latency in Lewis rats. Groups of Lewis rats were exposed to UV‐inactivated γHV‐68 (UV‐HV68, n=5) or infected with γHV‐68 (γHV‐68, n=6). (A) At the peak of leukocytosis (day 15 post‐infection), rats were killed and the number of splenic leukocytes quantified. Results are presented as mean values (± standard deviations). (B) DNA was also isolated and PCR performed to detect the presence of the genes encoding viral gp150 or G3PDH. Results are presented as amplified PCR products electrophoresed on ethidium‐bromide‐stained agarose gels. (C) Groups of Lewis rats (n=4) were infected with γHV‐68 and, at the indicated days post‐infection, the presence of latent virus in splenic leukocytes was quantified. Results are presented as mean infectious centers (± standard deviations). These studies were performed three times with similar results.
Figure 5
Figure 5
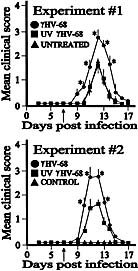
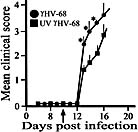
Lewis rats infected with γHV‐68 show increased clinical scores during passive‐transfer‐induced EAE. Groups of Lewis rats were exposed to UV‐inactivated γHV‐68 (closed squares, n=7) or infected with γHV‐68 (closed circles, n=8). At 7 days post‐infection (as indicated by the arrow), rats received 3×10⁶ encephalitogenic T lymphocytes by passive administration via tail‐vein injection. Following administration of encephalitogenic T lymphocytes, rats were monitored daily in a blinded fashion for the presence of clinical symptoms. Results are presented as mean clinical scores (± standard deviations) at the indicated times post‐immunization. Asterisks indicate significant differences (p<0.01) when comparing γHV‐68‐infected rats versus rats exposed to UV‐inactivated γHV‐68. For comparison, the panel for experiment #1 shows induction of EAE in rats given encephalitogenic T lymphocytes but not treated with γHV‐68 or UV γHV‐68 (closed triangles, n=4). In addition, the panel for experiment #2 shows a lack of clinical symptoms inγHV‐68‐infected rats given normal, Con‐A‐activated T lymphocytes (closed triangles, n=3). The two experiments shown are representative of four separate studies.
Figure 6
Figure 6
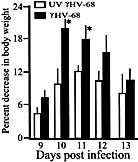
Lewis rats infected with γHV‐68 show increased weight loss during passive‐transfer‐induced EAE. Groups of Lewis rats were exposed to UV‐inactivated γHV‐68 (n=7) or infected with γHV‐68 (n=8). At 7 days post‐infection, rats received 3×10⁶ encephalitogenic T lymphocytes by passive administration via tail‐vein injection. Following administration of encephalitogenic T lymphocytes, rats were weighed on a daily basis. Results are presented as mean percent decreases in body weight (± standard deviations) at the indicated times post‐immunization. Asterisks indicate significant differences (p<0.01) when comparing γHV‐68‐infected rats versus rats exposed to UV‐inactivated γHV‐68.
Figure 7
Figure 7
Lewis rats infected with γHV‐68 show increased clinical scores following high‐dose administration of encephalitogenic T lymphocytes. Groups of Lewis rats were exposed to UV‐inactivated γHV‐68 (closed squares, n=6), or infected with γHV‐68 (closed circles, n=6). At 10 days post‐infection (as indicated by the arrow), rats received 3×10⁷ encephalitogenic T lymphocytes by passive administration via tail‐vein injection. Following administration of encephalitogenic T lymphocytes, rats were monitored daily in a blinded fashion for the presence of clinical symptoms. Results are presented as mean clinical scores (± standard deviations) at the indicated times post‐immunization. Asterisks indicate significant differences (p<0.01) when comparing γHV‐68‐infected rats versus rats exposed to UV‐inactivated γHV‐68.
Figure 8
Figure 8
Lewis rats latently infected with γHV‐68 display increased clinical scores during passive‐transfer‐induced EAE. Groups of Lewis rats were exposed to UV‐inactivated γHV‐68 (closed squares, n=6), or infected with γHV‐68 (closed circles, n=6). At 41 days post‐infection (as indicated by the arrow), rats received 3×10⁶ encephalitogenic T lymphocytes by passive administration via tail‐vein injection. Following administration of encephalitogenic T lymphocytes, rats were monitored daily in a blinded fashion for the presence of clinical symptoms. Results are presented as mean clinical scores (± standard deviations) at the indicated times post‐immunization. Asterisks indicate significant differences (p<0.01) when comparing γHV‐68‐infected rats versus rats exposed to UV‐inactivated γHV‐68. These studies were performed twice with similar results.
Figure 9
Figure 9
Absence of detectable γHV‐68 viral DNA in the CNS of Lewis rats undergoing clinical EAE. Groups of Lewis rats were exposed to UV‐inactivated γHV‐68 (γHV‐68 –) or infected with γHV‐68 (γHV‐68 +) as indicated. Within the latter group, some rats were non‐treated (EAE –) or some rats were administered encephalitogenic T cells to induce EAE (EAE +) as indicated. Rats that were exposed to UV‐inactivated γHV‐68 or infected with γHV‐68, without EAE induction (n=3), were killed at day 15 post‐infection, which represents the peak of leukocytosis. Rats infected and administered encephalitogenic T cells to induce EAE (n=3) were killed at day 12 post‐infection, when rats had clinical scores between 1 and 2. After the rats were killed, tissue from the spleen and spinal cord was taken and DNA extracted for PCR to amplify the genes encoding γHV‐68 gp150 or G3PDH. The number of PCR cycles used for each amplification is indicated. Results are presented as amplified PCR products electrophoresed on ethidium‐bromide‐stained agarose gels. These studies were performed twice with similar results.

References

    1. von Herrath, M. G., Obstacles to identifying viruses that cause autoimmune disease. J. Neuroimmunol. 2000. 107: 154–160. - PubMed
    1. Hickey, W. F., The pathology of multiple sclerosis: a historical perspective. J. Neuroimmunol. 1999. 98: 37–44. - PubMed
    1. Granieri, E., Exogeneous factors in the aetiology of multiple sclerosis. J. Neurovirol. 2000. 6: S141–S146. - PubMed
    1. Lauer, K., The risk of multiple sclerosis in the U.S.A. in relation to sociogeographic features: a factor‐analytic study. J. Clin. Epidemiol. 1994. 47: 43–48. - PubMed
    1. Gale, C. R. and Martyn, C. N., Migrant studies in multiple sclerosis. Prog. Neurobiol. 1995. 47: 425–448. - PubMed

Publication types

MeSH terms

LinkOut - more resources