Comparative Study
. 2003 Aug 15;551(Pt 1):125-38.
doi: 10.1113/jphysiol.2003.041608. Epub 2003 Jun 17.

Sarcoplasmic reticulum calcium release compared in slow-twitch and fast-twitch fibres of mouse muscle

Affiliations
Comparative Study

Sarcoplasmic reticulum calcium release compared in slow-twitch and fast-twitch fibres of mouse muscle

S M Baylor et al. J Physiol. .

Abstract

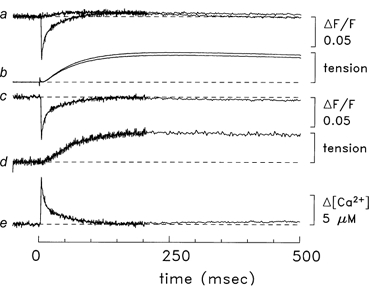
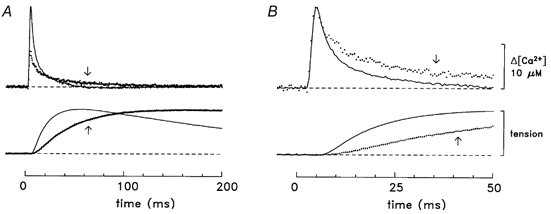
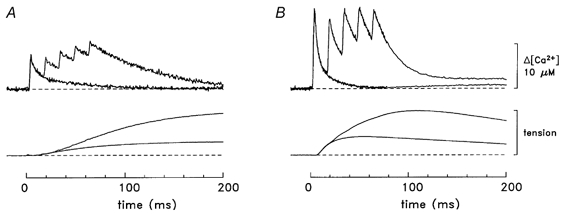
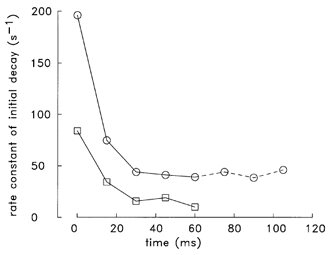
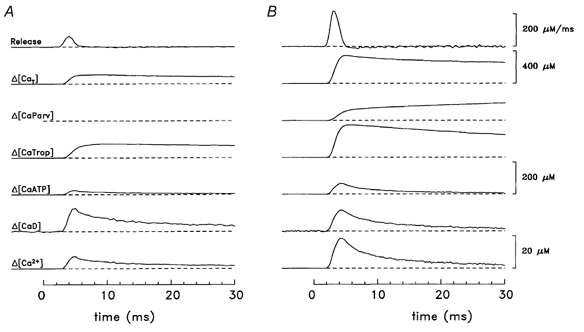
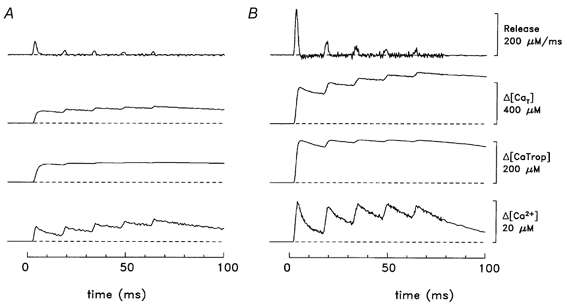
Experiments were carried out to compare the amplitude and time course of Ca2+ release from the sarcoplasmic reticulum (SR) in intact slow-twitch and fast-twitch mouse fibres. Individual fibres within small bundles were injected with furaptra, a low-affinity, rapidly responding Ca2+ indicator. In response to a single action potential at 16 degrees C, the peak amplitude and half-duration of the change in myoplasmic free [Ca2+] (Delta[Ca2+]) differed significantly between fibre types (slow-twitch: peak amplitude, 9.4 +/- 1.0 microM (mean +/- S.E.M.); half-duration, 7.7 +/- 0.6 ms; fast-twitch: peak amplitude 18.5 +/- 0.5 microM; half-duration, 4.9 +/- 0.3 ms). SR Ca2+ release was estimated from Delta[Ca2+] with a computational model that calculated Ca2+ binding to the major myoplasmic Ca2+ buffers (troponin, ATP and parvalbumin); buffer concentrations and reaction rate constants were adjusted to reflect fibre-type differences. In response to an action potential, the total concentration of released Ca2+ (Delta[CaT]) and the peak rate of Ca2+ release ((d/dt)Delta[CaT]) differed about 3-fold between the fibre types (slow-twitch: Delta[CaT], 127 +/- 7 microM; (d/dt)Delta[CaT], 70 +/- 6 microM ms-1; fast-twitch: Delta[CaT], 346 +/- 6 microM; (d/dt)Delta[CaT], 212 +/- 4 microM ms-1). In contrast, the half-duration of (d/dt)Delta[CaT] was very similar in the two fibre types (slow-twitch, 1.8 +/- 0.1 ms; fast-twitch, 1.6 +/- 0.0 ms). When fibres were stimulated with a 5-shock train at 67 Hz, the peaks of (d/dt)Delta[CaT] in response to the second and subsequent shocks were much smaller than that due to the first shock; the later peaks, expressed as a fraction of the amplitude of the first peak, were similar in the two fibre types (slow-twitch, 0.2-0.3; fast-twitch, 0.1-0.3). The results support the conclusion that individual SR Ca2+ release units function similarly in slow-twitch and fast-twitch mammalian fibres.


Figures

Figure 1
Figure 1. Ca2+ and tension responses from a bundle of soleus fibres that contained one fibre injected with furaptra
Zero time marks the moment that the bundle was stimulated by a single shock. The top trace in a is the average of four ΔF/F responses that were just sub-threshold for detection of a Ca2+ transient by furaptra. The other trace in this pair is the average of four supra-threshold responses; the average amplitude of the supra-threshold stimulus was 2 % larger than that of the sub-threshold stimulus. After 206 ms, the data collection protocol used 4-point averaging, which reduced the noise on the traces. The next pair of traces (b) shows the tension responses associated with the supra- and sub-threshold stimuli; a stimulus artifact is apparent at time zero. Trace c is the supra-threshold ΔF/F response minus the sub-threshold ΔF/F response; prior to the subtraction, a 5-point smoothing algorithm was applied to the sub-threshold response to reduce the influence of high-frequency noise. Trace d is the difference tension record (supra-threshold response minus sub-threshold response), which is displayed at higher vertical gain. (In this and subsequent figures, the amplitude of the tension calibration bar corresponds to the maximum evoked tension response.) Trace e is Δ[Ca2+] calculated from the trace c using eqns (1) and (2). Fibre, 062597.1; diameter, 30 μm; sarcomere length, 3.8 μm; estimated furaptra concentration, 200 μM; temperature, 16 °C.
Figure 2
Figure 2. Comparison of Ca2+ and tension responses in slow-twitch and fast-twitch fibres
A, Δ[Ca2+] and twitch tension averaged from four experiments with soleus muscle (dotted lines, identified by arrows) and seven experiments with EDL muscle (continuous lines) of the type illustrated in Fig. 1. The selected experiments had minimal contamination of the Δ[Ca2+] signal by movements artifacts. The mean diameter of the fibres was 37 ± 6 μm for soleus and 41 ± 2 μm for EDL muscle. Where necessary, records were temporally shifted (average shift, 1 data point = 0.5 ms) to align the rising phases of the Δ[Ca2+] signals. The total number of Δ[Ca2+] responses averaged was 31 for soleus and 13 for EDL. The slow-twitch Δ[Ca2+] record has a peak amplitude of 8.0 μM, a time to half-rise of 3.4 ms, a time to peak of 4.5 ms and a half-duration of 7.6 ms; the corresponding values for the fast-twitch record are 18.2 μM, 3.5 ms, 4.5 ms and 4.8 ms, respectively. The tension response from each experiment was scaled to unity amplitude prior to averaging. The slow-twitch tension record has a time to half-rise of 38 ms, a time to peak of 184 ms and a half-duration of 767 ms; the corresponding values for the fast-twitch record are 17 ms, 54 ms and 215 ms, respectively. B, same traces as in A displayed on a faster time base and with the slow-twitch Δ[Ca2+] scaled to have the same peak amplitude as that of the fast-twitch Δ[Ca2+]. Temperature, 16 °C.
Figure 3
Figure 3. Δ[Ca2+] and tension responses from fibres stimulated by a single shock and five shocks at 67 Hz
A, slow-twitch responses (fibre, 062597.1). B, fast-twitch responses (averaged results from fibres 032596.2, 040596.1, 040896.1 and 040996.3). In A, the Δ[Ca2+] record following a single-shock has a peak amplitude of 7.6 μM, a time to half-rise of 3.7 ms, a time to peak of 4.5 ms and a half-duration of 8.2 ms; the corresponding values in B are 17.5 μM, 3.0 ms, 4.0 ms and 4.5 ms, respectively. For the tension responses in A, the values of time to half-rise, time to peak and half-duration are 55, 307 and 1360 ms, respectively (single shock) and 82, 342 and 1320 ms, respectively (multiple-shock); in B, the values are 16, 55 and 215 ms, respectively (single shock) and 34, 107 and 236 ms, respectively (multiple-shock). Temperature, 16 °C.
Figure 4
Figure 4. Initial decay rate constants of Δ[Ca2+] at different times during a 67 Hz train of stimuli
Decay rate constants (1/τ) were estimated for the initial decline of Δ[Ca2+] from individual peaks of the type illustrated in Fig. 3: □, slow-twitch fibres; ○, fast-twitch fibres. For each estimate, eqn (3) was fitted to the Δ[Ca2+] data during the 6 ms period beginning immediately after peak; similar relative rates (not shown) were obtained from straight line fits to the same data sets. The abscissa shows the time during the train beginning at the time of the first shock. The fibres that contributed to the plot are those of Fig. 3 plus one additional fast-twitch fibre (040996.1, which was stimulated by an 8-shock train; the data for the three extra shocks for this fibre are connected by dashed lines). At t ≤ 60 ms, the fast-twitch data are the average values from five individual experiments; values of S.E.M. for these data are not shown, as, in all cases, they were less than the symbol size.
Figure 5
Figure 5. Myoplasmic Ca2+ binding and SR Ca2+ release in response to a single shock
A, slow-twitch (fibre, 062597.1; sarcomere length, 3.8 μm; furaptra concentration, 200 μM). B, fast-twitch (fibre, 040896.1; sarcomere length, 3.8 μm; furaptra concentration, 74 μM). All units of concentration are moles of Ca2+ per litre of myoplasmic water. The 20 μM calibration bar applies to Δ[Ca2+] and Δ[CaD]; the 200 μM calibration bar applies to Δ[CaATP], Δ[CaTrop], and Δ[CaParv]. The top trace (labelled Release) is (d/dt)Δ[CaT]. To reduce noise on the modelled traces during the baseline period, the fluctuations on the Δ[Ca2+] traces were set to zero prior to the onset of Δ[Ca2+]. The peak occupancies of the troponin sites with Ca2+ ([CaTrop]R + Δ[CaTrop]) are 103 μM (A) and 219 μM (B), corresponding to fractional occupancies of 0.858 and 0.912, respectively. Temperature, 16 °C.
Figure 6
Figure 6. Myoplasmic Ca2+ binding and SR Ca2+ release in response to a 5-shock train at 67 Hz
A, slow-twitch; B, fast-twitch (same fibres as in Fig. 5.) For simplicity, the traces for Δ[CaD], Δ[CaATP] and Δ[CaParv] are not shown. In response to the first shock, the peaks of release were 64 and 215 μM ms−1 (A and B, respectively). During the period 10-70 ms, the average occupancies of the troponin sites with Ca2+ ([CaTrop]R + Δ[CaTrop]) are 109 μM (A) and 216 μM (B), corresponding to fractional occupancies of 0.908 and 0.900, respectively. Temperature, 16 °C.

References

    1. Abate F, Bruton JD, De Haan A, Westerblad H. Prolonged force increase following a high-frequency burst is not due to a sustained elevation of [Ca2+]i. Am J Physiol Cell Physiol. 2002;283:C42–47. - PubMed
    1. Baker AJ, Brandes R, Schreur JH, Camacho SA, Weiner MW. Protein and acidosis alter calcium-binding and fluorescence spectra of the calcium indicator indo-1. Biophys J. 1994;67:1646–1654. - PMC - PubMed
    1. Baylor SM, Chandler WK, Marshall MW. Sarcoplasmic reticulum calcium release in frog skeletal muscle fibres estimated from arsenazo III calcium transients. J Physiol. 1983;344:625–666. - PMC - PubMed
    1. Baylor SM, Hollingworth S. Fura-2 calcium transients in frog skeletal muscle fibres. J Physiol. 1988;403:151–192. - PMC - PubMed
    1. Baylor SM, Hollingworth S. Model of sarcomeric Ca2+ movements, including ATP Ca2+ binding and diffusion, during activation of frog skeletal muscle. J Gen Physiol. 1998;112:297–316. - PMC - PubMed

Publication types

LinkOut - more resources