Mitochondrial and myoplasmic [Ca2+] in single fibres from mouse limb muscles during repeated tetanic contractions
- PMID: 12815178
- PMCID: PMC2343157
- DOI: 10.1113/jphysiol.2003.043927
Mitochondrial and myoplasmic [Ca2+] in single fibres from mouse limb muscles during repeated tetanic contractions
Abstract
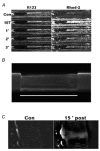
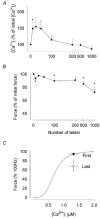
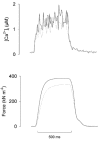
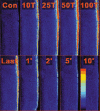
Previous studies on single fast-twitch fibres from mouse toe muscles have shown marked fatigue-induced changes in the free myoplasmic [Ca2+] ([Ca2+]i), while mitochondrial [Ca2+] remained unchanged. We have now investigated whether muscle fibres from the legs of mice respond in a similar way. Intact, single fibres were dissected from the soleus and extensor digitorum longus (EDL) muscles of adult mice. To measure [Ca2+]i, indo-1 was injected into the isolated fibres. Mitochondrial [Ca2+] was measured using Rhod-2 and confocal laser microscopy. Fatigue was induced by up to 1000 tetanic contractions (70 Hz) given at 2 s intervals. In soleus fibres, there was no significant decrease in tetanic [Ca2+]i at the end of the fatiguing stimulation, whereas tetanic force was significantly reduced by about 30 %. In 10 out of 14 soleus fibres loaded with Rhod-2 and subjected to fatigue, mitochondrial [Ca2+] increased to a maximum after about 50 tetani; this increase was fully reversed within 20 min after the end of stimulation. The force-frequency curve of the non-responding soleus fibres was shifted to higher frequencies compared to that of the responding fibres. In addition, eight out of nine Rhod-2-loaded EDL fibres showed similar changes in mitochondrial [Ca2+] during and after a period of fatiguing stimulation. The stimulation-induced increase in mitochondrial [Ca2+] was reduced when mitochondria were depolarised by application of carbonyl cyanide 4-(trifluoromethoxy)phenylhydrazone, whereas it was increased by application of an inhibitor of the mitochondrial Na+/Ca2+ exchange (CGP-37157). In conclusion, isolated slow-twitch muscle fibres show only modest changes in tetanic force and [Ca2+]i during repeated contractions. The increase in mitochondrial Ca2+ does not appear to be essential for activation of mitochondrial ATP production, nor does it cause muscle damage.
Figures


Similar articles
-
Mitochondrial function in intact skeletal muscle fibres of creatine kinase deficient mice.J Physiol. 2003 Oct 15;552(Pt 2):393-402. doi: 10.1113/jphysiol.2003.050732. J Physiol. 2003. PMID: 14561823 Free PMC article.
-
Mitochondrial Ca2+ in mouse soleus single muscle fibres in response to repeated tetanic contractions.Adv Exp Med Biol. 2003;538:557-62; discussion 562. doi: 10.1007/978-1-4419-9029-7_49. Adv Exp Med Biol. 2003. PMID: 15098698 No abstract available.
-
Changes in mitochondrial Ca2+ detected with Rhod-2 in single frog and mouse skeletal muscle fibres during and after repeated tetanic contractions.J Muscle Res Cell Motil. 2001;22(3):265-75. doi: 10.1023/a:1012227009544. J Muscle Res Cell Motil. 2001. PMID: 11763199
-
Mechanisms underlying changes of tetanic [Ca2+]i and force in skeletal muscle.Acta Physiol Scand. 1996 Mar;156(3):407-16. doi: 10.1046/j.1365-201X.1996.196000.x. Acta Physiol Scand. 1996. PMID: 8729701 Review.
-
Metabolic factors contributing to altered Ca2+ regulation in skeletal muscle fatigue.Acta Physiol Scand. 2003 Sep;179(1):39-48. doi: 10.1046/j.1365-201X.2003.01169.x. Acta Physiol Scand. 2003. PMID: 12940937 Review.
Cited by
-
Study of the union method of microelectrode array and AFM for the recording of electromechanical activities in living cardiomyocytes.Eur Biophys J. 2017 Jul;46(5):495-507. doi: 10.1007/s00249-016-1192-4. Epub 2016 Dec 23. Eur Biophys J. 2017. PMID: 28012038
-
Measurement and simulation of myoplasmic calcium transients in mouse slow-twitch muscle fibres.J Physiol. 2012 Feb 1;590(3):575-94. doi: 10.1113/jphysiol.2011.220780. Epub 2011 Nov 28. J Physiol. 2012. PMID: 22124146 Free PMC article.
-
Non-invasive in vivo imaging of calcium signaling in mice.PLoS One. 2007 Oct 3;2(10):e974. doi: 10.1371/journal.pone.0000974. PLoS One. 2007. PMID: 17912353 Free PMC article.
-
Differential impact of mitochondrial positioning on mitochondrial Ca(2+) uptake and Ca(2+) spark suppression in skeletal muscle.Am J Physiol Cell Physiol. 2011 Nov;301(5):C1128-39. doi: 10.1152/ajpcell.00194.2011. Epub 2011 Aug 17. Am J Physiol Cell Physiol. 2011. PMID: 21849670 Free PMC article.
-
Mitochondrial Ca(2+) uptake in skeletal muscle health and disease.Sci China Life Sci. 2016 Aug;59(8):770-6. doi: 10.1007/s11427-016-5089-3. Epub 2016 Jul 19. Sci China Life Sci. 2016. PMID: 27430885 Free PMC article. Review.
References
-
- Butinas L, Gunter KL, Sparagna GC, Gunter TE. The rapid mode of calcium uptake into heart mitochondria (RaM): comparison to RaM in liver mitochondria. Biochim Biophys Acta. 2001;1504:248–261. - PubMed
-
- Chen G, Carroll S, Racay P, Dick J, Pette D, Traub I, Vrbova G, Eggli P, Celio M, Schwaller B. Deficiency in parvalbumin increases fatigue resistance in fast-twitch muscle and upregulates mitochondria. Am J Physiol Cell Physiol. 2001;281:C114–122. - PubMed
-
- Dahlstedt AJ, Katz A, Wieringa B, Westerblad H. Is creatine kinase responsible for fatigue? Studies of isolated skeletal muscle deficient in creatine kinase. FASEB J. 2000;14:982–990. - PubMed
Publication types
MeSH terms
Substances
LinkOut - more resources
Full Text Sources
Research Materials
Miscellaneous

